Central PA’s submarket clusters for industrial real estate have some of the lowest vacancy rates and highest rental rates we have seen in recent years.

It’s the news that every commercial real estate developer and investor want to hear – the industrial real estate market in Central Pennsylvania ended Q2 2018 with some of the highest rental rates and lowest vacancy rates the market has experienced since 2014.
Now, it hasn’t been a steady climb over the last four years. Rather there’s been quite a bit of volatility in the market, with numbers bouncing up and down and up and down. However, it does appear that the extreme peaks and valleys have evened out and a more stable, yet steadily growing industrial real market has emerged in Central PA – at least for the present moment.
Let’s take a closer look at some of the most interesting trends and numbers reported from CoStar’s Q1 2018 report for Harrisburg/Carlisle, Lancaster and York/Hanover Submarket Clusters.
Harrisburg/Carlisle Submarket Cluster
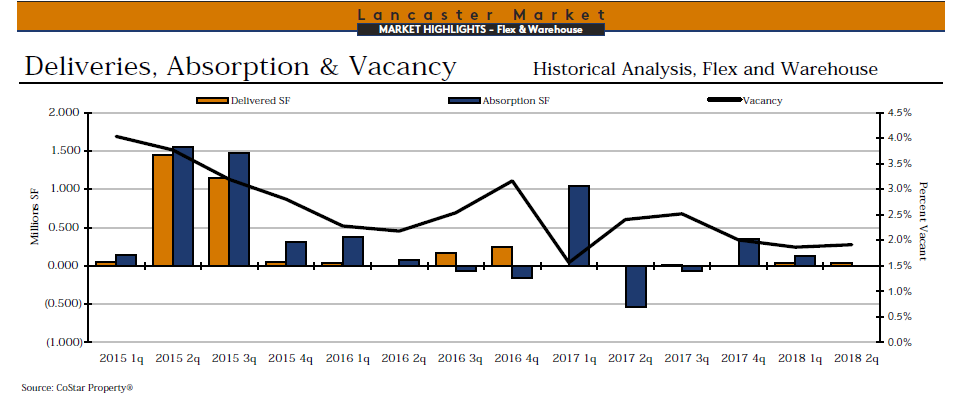
Vacancy – The industrial vacancy rate for the Harrisburg/Carlisle Submarket Cluster fell significantly from Q1 2018 where it was previously 9.4% to its now 7.9%. This is the largest drop between a single quarter that the market has seen since prior to Q3 2014. In fact, starting with Q2 2017, the industrial vacancy rate for the Harrisburg/Carlisle Submarket Cluster has been quite volatile, swinging up and down by sometimes more than one percentage point in a quarter.

Absorption – The pattern of volatility in the Harrisburg/Carlisle Submarket Cluster continues with its net absorption. Though the market ended 2017 at a positive 2,692,866 square-feet, in Q1 2018 this dropped to a negative (2,132,086) square-feet, mostly due to a single building of 1,100,000 square-feet that was delivered that same quarter. Now in Q2 2018, net absorption is back in the positive at 1,385,445 square-feet with no new buildings delivered this quarter.
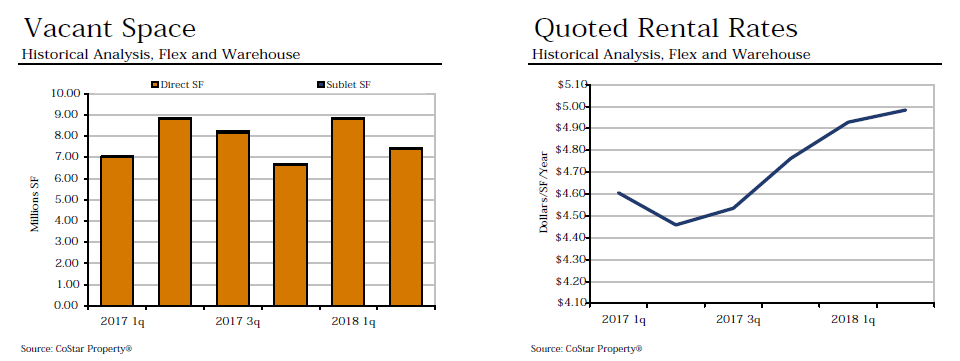
Rental Rates – The average quoted asking rental rate for available industrial space is $4.98. This has been steadily increasing ever since it experienced a drop in Q2 2017 where it dropped from $4.61 to $4.46 in one quarter. Now at almost $5.00 per square foot of space, the Harrisburg/Carlisle Submarket Cluster’s rental rates for industrial space is the highest it has been since prior to Q3 2014.
Inventory – As mentioned above, no new buildings were delivered this quarter, or in all of 2018. Three buildings are currently under construction, totaling 2,951,468 square-feet of new space. It’s estimated that these properties will not be delivered until early 2019.
Lancaster Submarket Cluster
Vacancy – The vacancy rate for the Lancaster Submarket Cluster in Q2 2018 held steady at 1.9%, the same as it was in Q1 2018. In fact, it has changed minimally from the 2.0% that Q4 2017 ended with. Previous to these last three quarters, there has been a lot more change from quarter to quarter in the Lancaster Submarket Cluster’s vacancy rate. To be this low, and this consistent for three quarters indicates a stable market with supply and demand near evenly matched.
Absorption – As for net absorption, Q2 2018 ended with a positive 2,723 square-feet. This is a drop of 127,888 square feet from Q1’s net absorption of 130,611 square-feet. After experiencing two quarters of negative net absorption in Q2 and Q3 2017, and rebounding to positive 354,056 square-feet in Q4, this is now the third quarter that net absorption has continued to drop, though still a positive number – for now.

Rental Rates – The quoted asking rental rate for available industrial space in the Lancaster Submarket Cluster took a hit this quarter when it dropped from $4.74 to $4.57 per square foot. The trend in rental rates have been up and down and up and down over the course of the last four years. While it peaked at $5.15 per square foot in Q4 2016, it has never been able to return to that high and is now trending downward, inching closer to the numbers we saw in early 2015.
Inventory – One new building was delivered this quarter, adding 35,768 square-feet of new space to the industrial market. There are no other buildings currently under construction in the Lancaster Submarket Cluster.
York/Hanover Submarket Cluster
Vacancy – The industrial vacancy rate for the York/Hanover Submarket Cluster dipped ever so slightly this quarter from 4.4% in Q1 2018 to its current 4.3%. This is the lowest vacancy has been in over a year when it was also 4.3% in Q1 2017. From that point, the vacancy rate was on the rise, peaking at 5.0% in Q4 2017, then dropping 0.6% points to 4.4% in Q1 2018.
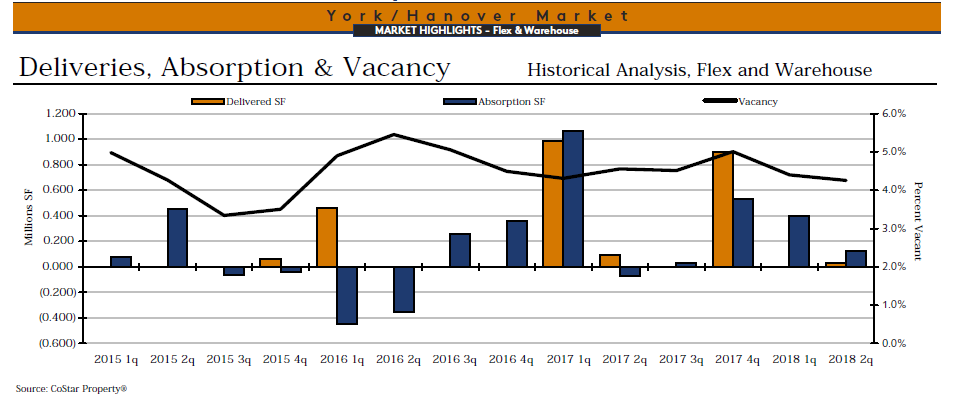
Absorption – Q2 2018 ended with a net absorption of 125,766 square-feet. Looking at Q1’s net absorption of 396,112 square-feet, this is a drop of 270,345 square-feet in a single quarter. Between these two quarters only one new building of 30,000 square feet was delivered to the market.
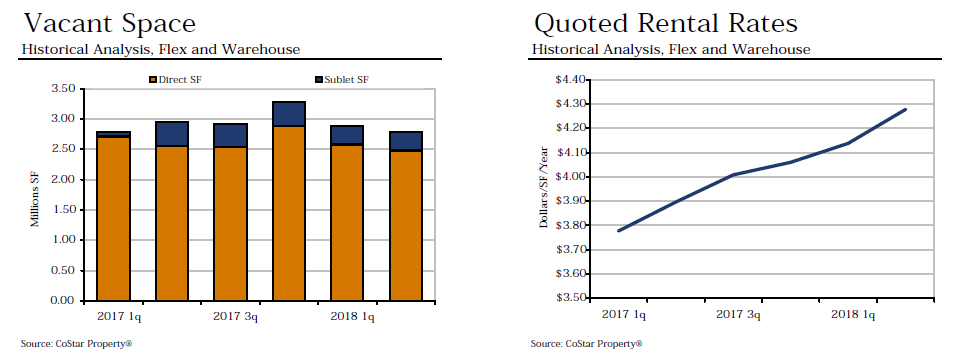
Rental Rates – The Lancaster Submarket Cluster ended Q2 2018 with a quoted asking rental rate of $4.28. This is $0.14 higher than it was in Q1 and $0.22 higher than in Q4 2017. In fact, this is the highest rental rate this submarket cluster has seen since prior to Q3 2014 with it near steadily rising during that entire period.
Inventory – Only one new building was delivered in Q2 2018 and that added 30,000 square-feet of industrial space to the market. There are currently no new buildings under construction at this time.
Key Takeaways
Given all the activity taking place in the various Central PA submarket clusters, there are particular insights that are important to note. First, we can expect vacancies to remain at record lows for the remainder of 2018, despite a further uptick in new construction. Additionally, E-commerce sales grew 15.2% in Q2 2018, compared with the same time last year and now represent 9% of total sales. E-commerce will continue to be a driving force in the foreseeable future.
While indicators point to strong demand, there are headwinds increasing from labor shortages and tariffs. With the economy at or near full employment, site selection decisions and supply chain nodes may be driven out to secondary and tertiary markets. Finally, it is too early to predict the exact impact of tariffs on the industrial market, but we can look for potential declines in import and export levels.
Looking at the comparison of the three Central Pennsylvania submarket clusters, which do you feel has the strongest industrial real estate market right now? What changes do you anticipate taking place throughout the rest of 2018?
Share your ideas by leaving a comment below!