 According to the data from the U.S. Census American Community Survey, released on September 15, Central Pennsylvania is following in suit with greater Philadelphia – and the rest of the nation – which is experiencing an increase in median household incomes. Taking into consideration Cumberland, Dauphin, Lancaster, Lebanon and York Counties, here are some of the most notable trends published in the report.
The highest median household income is Cumberland County at $63,890; in contrast, the lowest median household income is Lebanon County at $52,571. Lancaster County increased the most in the last year, by $1,859. Decreasing the most was Lebanon County, by $1,497.
Lancaster County has the lowest median income for Black or African American households at $32,445. While the lowest median income for Hispanic or Latino households is Lebanon County at $25,422. The greatest difference in median income between male versus female householder (with no spouse present) is $18,429 in Cumberland County.
For all counties, the highest median income was for householders between the ages of 45 to 64 years old and for households of married couple families. Also, female householders (with no spouse present) always earned less than male householders (with no spouse present).
If you’re curious what other trends emerged and what these trends tell us about the health of our local economy, let’s take a closer look at each county’s specific numbers.
Cumberland County, Pennsylvania
The 2016 median household income in Cumberland County is $63,890. This number is up from $62,759 in 2014 and is the highest median income we have seen this decade. For householders between the ages of 45 to 64 years old, the median income rises to $78,960. Households of married couple families have the highest median income at $87,714. A male householder with no wife present has a median income of $54,837. In contrast, a female householder with no husband present has a median income of just $36,408. Black or African American households had a median income of $32,661 and Hispanic or Latino households had a median income of $35,097.
Dauphin County, Pennsylvania
The 2016 median household income in Dauphin County is $54,232. Up from $52,975 in 2014, this number has been on an almost steady rise for the last decade. For householders between the ages of 45 to 64 years old, the median income rises to $63,373. Households of married couple families have the highest median income at $79,328. A male householder with no wife present has a median income of $46,430. In contrast, a female householder with no husband present has a median income of just $35,520. Black or African American households had a median income of $37,823 and Hispanic or Latino households had a median income of $33,947.
Lancaster County Pennsylvania
The 2016 median household income in Lancaster County is $59,262. This county experienced the greatest increase in the Central PA region over the last year. Rising from $57,403 by $1,859, this is also the highest number we have seen this decade, which is especially notable since median income took a dip in 2010, falling to $51,740.
For householders between the ages of 45 to 64 years old, the median income rises to $73,155. Households of married couple families have the highest median income at $78,218. A male householder with no wife present has a median income of $47,391. In contrast, a female householder with no husband present has a median income of just $36,925. Black or African American households had a median income of $32,445 and Hispanic or Latino households had a median income of $38,125.
Lebanon County Pennsylvania
The 2016 median household income in Lebanon County is $52,571. Down from 2014’s median income of $54,068, Lebanon County experienced several ups and downs throughout the past decade. For householders between the ages of 45 to 64 years old, the median income rises to $60,578. Households of married couple families have the highest median income at $73,219. A male householder with no wife present has a median income of $44,239. In contrast, a female householder with no husband present has a median income of just $34,383. Black or African American households had a median income of $34,662 and Hispanic or Latino households had a median income of $25,422.
York County, Pennsylvania
The 2016 median household income in York County is $58,409. This was another Central PA county that decreased since 2014, though ever so slightly by just $178 ($58,587 in 2014). With several ups and downs in median income, the number has still mostly been on the rise over the past decade.
For householders between the ages of 45 to 64 years old, the median income rises to $72,004. Households of married couple families have the highest median income at $81,711. A male householder with no wife present has a median income of $46,681. In contrast, a female householder with no husband present has a median income of just $33,911. Black or African American households had a median income of $44,525 and Hispanic or Latino households had a median income of $33,182
Our Analysis
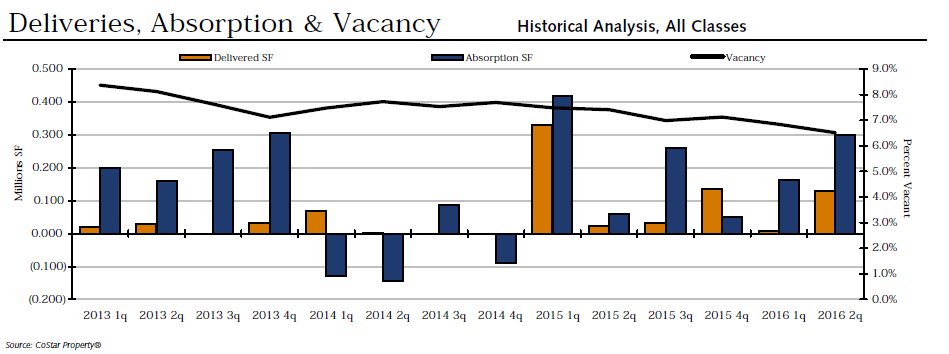
Increasing median household income is just one trend that affects commercial real estate. The local employment gains continue to be strong, with seasonally adjusted unemployment rate holding below 5.0 percent. This adds to the demand for housing in a variety of forms: for office space, for the retail sector and for industrial/distribution facilities.
Underlying inflation is extremely tame, providing no impetus for significantly higher rates. Lending rates and fixed income rates of return will remain low by historical standards. For most metro areas (including Central Pennsylvania) and property types, lower oil prices have been a net positive. Spending less on gasoline encourages consumers to spend more on other items, which helps retail and hotel market fundamentals.
Lower prices directly translate into an increase in household disposable income. Overall, the commercial property market in 2017 will continue to be characterized by strong fundamentals, increased investor flows and high transaction volume.
What median income was most surprising to you? What do you think some these trends say about the health of our local economy? Share your thoughts by commenting below!


 According to the PA Manufacturers Association, manufacturing and its affiliated businesses contribute $11 Billion to the economy in south-central Pennsylvania alone, providing our community with an estimated 110,000 jobs. This industry is a huge part of our local economy and its growth impacts the growth of many other businesses.