Lancaster closes Q3 with the strongest market while Harrisburg West shows signs of distress.
The submarkets that make up Central Pennsylvania’s office real estate market each have unique advantages and disadvantages that really show through when you examine each individually. With the close of the third-quarter, we took a closer look at how the four main submarkets performed individually and comparatively.
The outcomes should surprise you! You may think you know which of the four submarkets outperformed the others, which one is most likely in distress and the others that are sitting pretty stagnant right now. But you’ll likely be shocked by the large variances in numbers, especially when compared to the historical averages and forecasted averages of what is yet to come.
Let’s take a closer look at some of the most interesting trends and numbers reported from CoStar’s Q3 2018 office report for Harrisburg East, Harrisburg West, Lancaster and York.
Harrisburg East
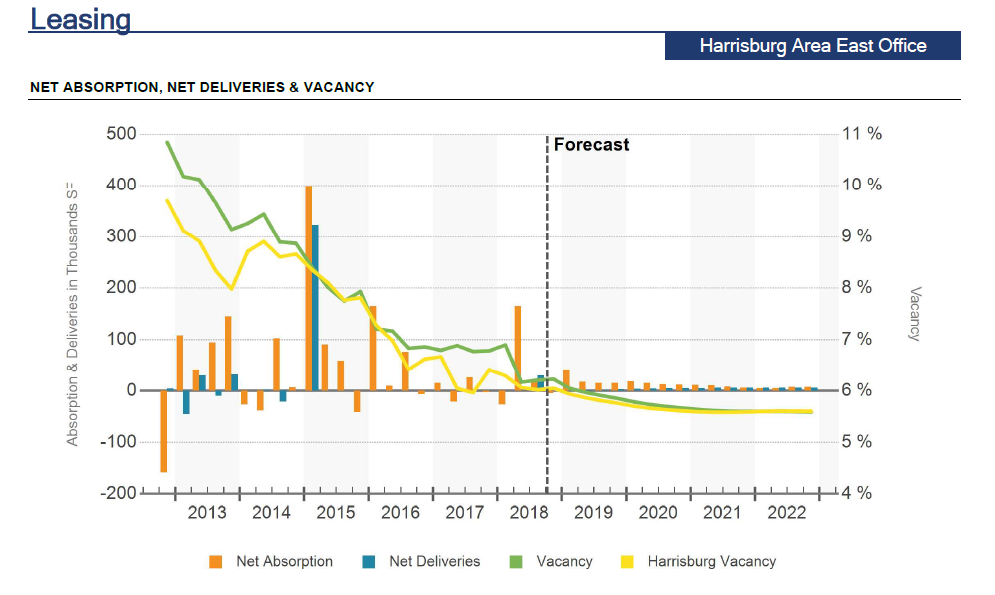
Vacancy – The vacancy rate for Q3 2018 in the Harrisburg East submarket is 6.4%. This is notably lower than the historical average of 7.8% and the forecast average shows this dipping lower to 5.7%. For comparison, the peak in vacancy rate occurred in Q4 2012 when it reached 10.8% and the trough was in Q4 1997 when it plummeted to 3.1%.

12 Month Net Absorption in SF – The twelve-month net absorption is 106,000 square-feet. While this is still lower than the historical average of 187,046 square-feet, the forecast average predicts the current net absorption will fall significantly to 61,648 square-feet. Though not by much, net absorption will at least remain in the black for now.
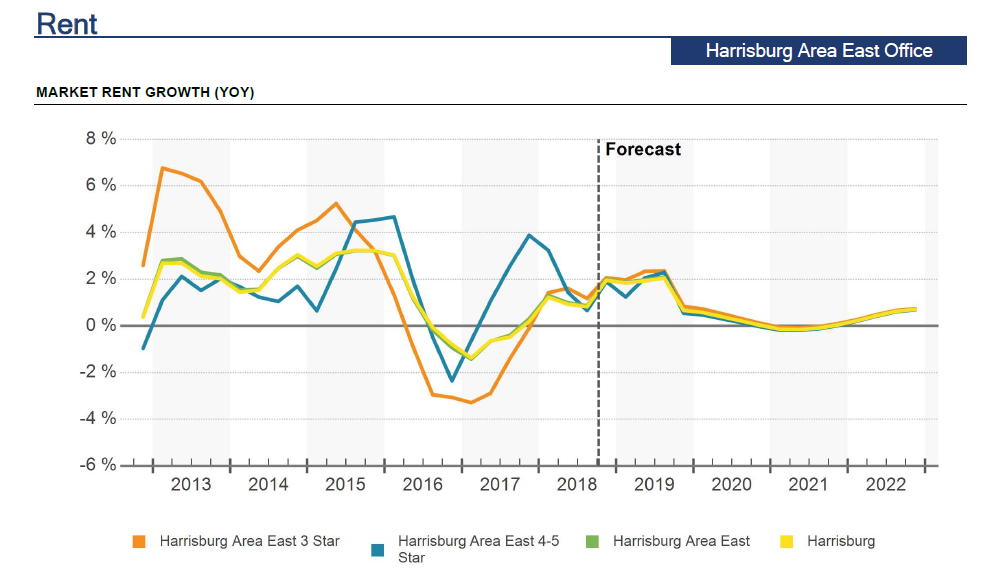
Rent Growth – The current 12 month rent growth is 2.0%. This is higher than the historical average of 1.4%, though the forecast average predicts that this will fall to 0.7%. For comparison, the peak in Harrisburg East’s rent growth occurred in Q1 2001 when it reached 8.3% and the trough was in Q4 2009 when it plummeted to -2.4%.
12 month deliveries in SF – Harrisburg East has a twelve-month delivery of 30,000 square-feet. This takes into account all of the deliveries that occurred over the last year; however no new buildings were delivered specifically in Q3 2018. Additionally, 20,000 square-feet of 4 and 5 star office space is under construction, which will be delivered in coming quarters.
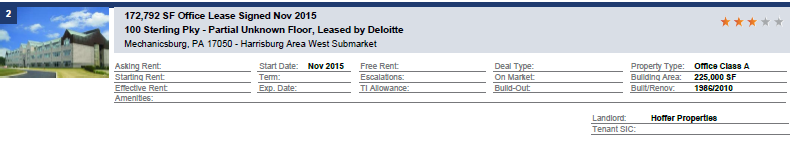
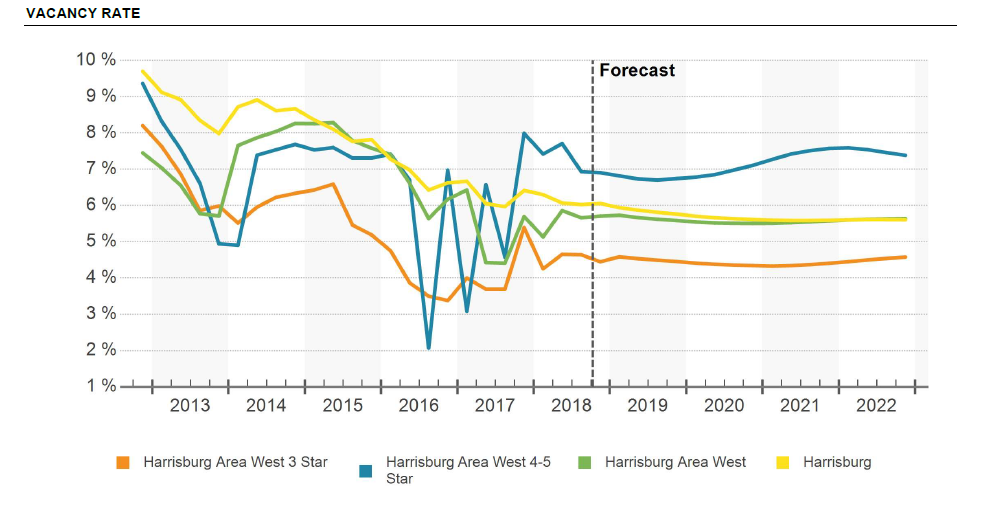
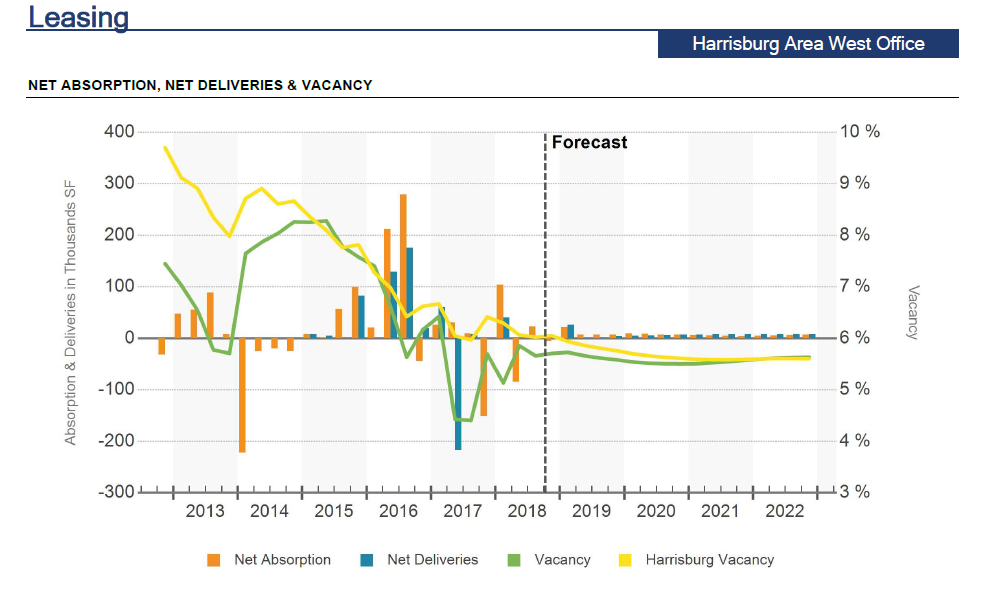
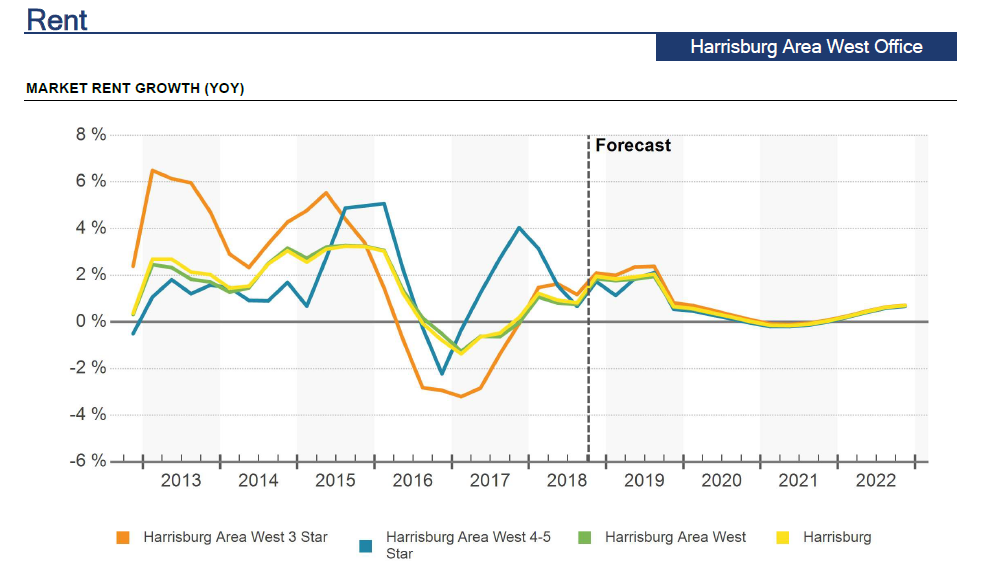
Harrisburg West
Vacancy – The vacancy rate for Q3 2018 in the Harrisburg West submarket is 7.3%. This is slightly higher than the historical average of 7.0%; however, CoStar’s forecast average predicts this to dip to 5.6%. For comparison, the peak in vacancy rate occurred in Q2 2002 when it reached 9.8% and the trough was in Q4 1997 when it plummeted to 2.5%.
12 Month Net Absorption in SF – The twelve-month net absorption is negative 258,000 square-feet. The historical average is 95,454 square-feet and the forecast average predicts the market will again return to positive numbers with 25,193 square-feet. Q3 net absorption is not far from where it was in Q4 2014 when it was negative w 292,042 square-feet. Since then, it peaked in Q3 2016 at 611,057 square-feet before falling substantially to its current negative state.
Rent Growth – The current 12 month rent growth is 1.9%. This is higher than the historical average of 1.4%, though the forecast average predicts that this will fall to 0.6%. For comparison, the peak in Harrisburg West’s rent growth occurred in Q3 2000 when it reached 7.1% and the trough was in Q4 2009 when it plummeted to -2.8%.
12 month deliveries in SF – Harrisburg West has a twelve-month delivery of 40,000 square-feet, compared to the historical average of 127,660 square-feet. This takes into account all of the deliveries that occurred over the last year; however no new buildings were delivered specifically in Q3 2018. Additionally, 26,400 square-feet of 3 star office space is under construction, which will be delivered in coming quarters.
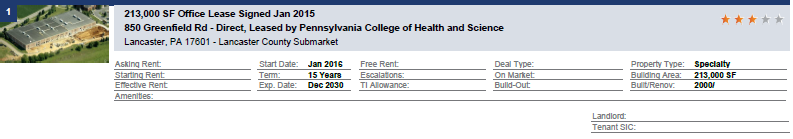
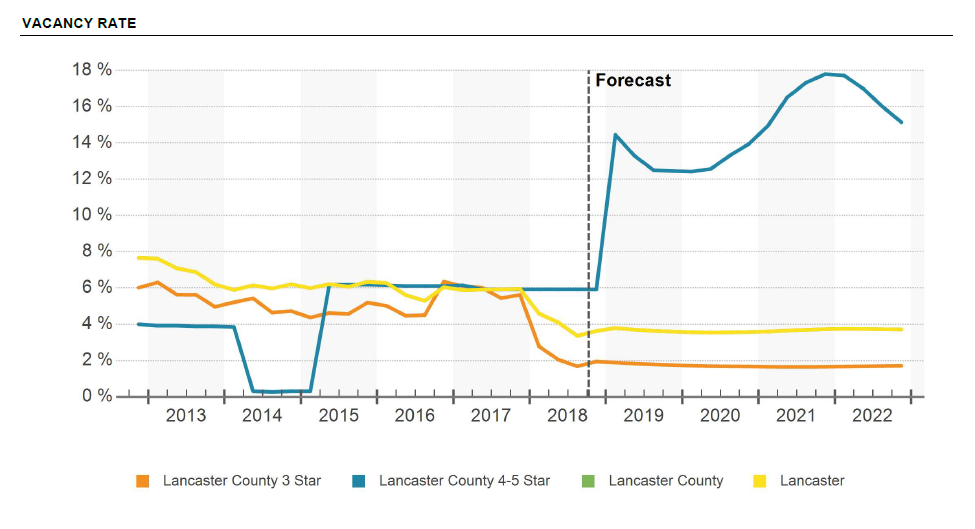
Lancaster
Vacancy – The vacancy rate for Q3 2018 in the Lancaster submarket is 3.6%. This is notably lower than the historical average of 6.8%; the forecast average predicts this remain fairly stable at 3.7%. For comparison, the peak in vacancy rate occurred in Q4 2004 when it reached 9.7%. The lowest the vacancy rate has ever been in Lancaster County is actually right now, in Q3 2018.
12 Month Net Absorption in SF – The twelve-month net absorption is 324,000 square-feet. The historical average is substantially lower than what it is currently and that is 109,103 square-feet. The forecast average predicts net absorption will decrease to 89,086 square-feet.

Rent Growth – The current 12 month rent growth is 4.9%. This is significantly higher than the historical average of 1.3%, though the forecast average predicts that this will fall to 1.6%. For comparison, the peak in Lancaster’s rent growth occurred in Q3 2000 when it reached 6.9% and the trough was in Q4 2009 when it plummeted to -5.0%.
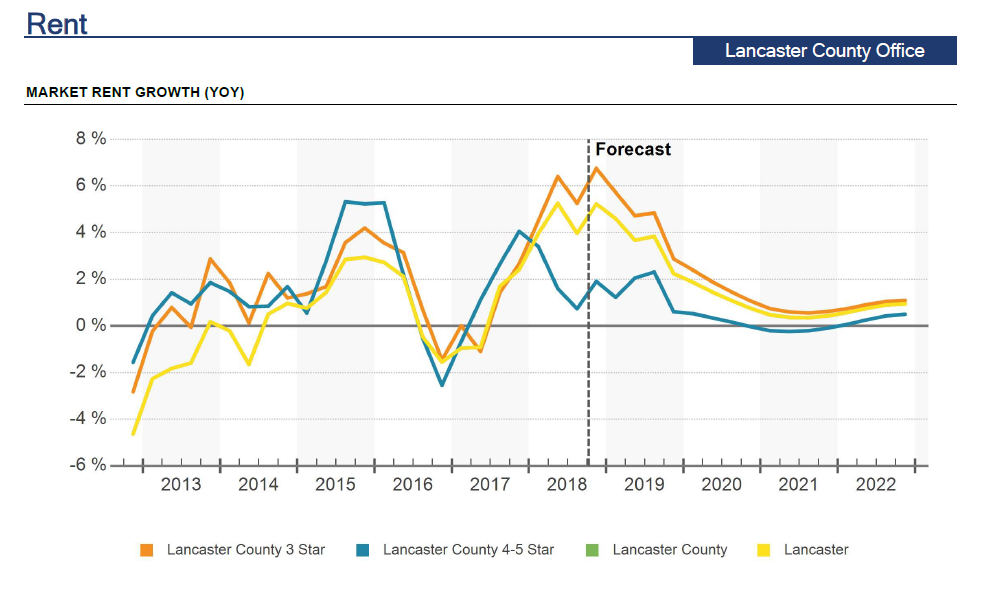
12 month deliveries in SF – Lancaster has a twelve-month delivery of 12,000 square-feet, compared to the historical average of 114,237 square-feet. This takes into account all of the deliveries that occurred over the last year; however no new buildings were delivered specifically in Q3 2018. Additionally, 81,840 square-feet of 4 and 5 star office space is under construction, which will be delivered in coming quarters.
York
Vacancy – The vacancy rate for Q3 2018 in the York submarket is 5.3%. This is lower than the historical average of 6.9%; the forecast average predicts this remain fairly stable at 5.4%. For comparison, the peak in vacancy rate occurred in Q1 2008 when it reached 10.5%. The lowest the vacancy rate has ever been was 2.2% in Q4 1998.
12 Month Net Absorption in SF – The twelve-month net absorption is 29,500 square-feet. The historical average is 72,892 square-feet. The forecast average predicts net absorption will decrease to 8,847 square-feet.
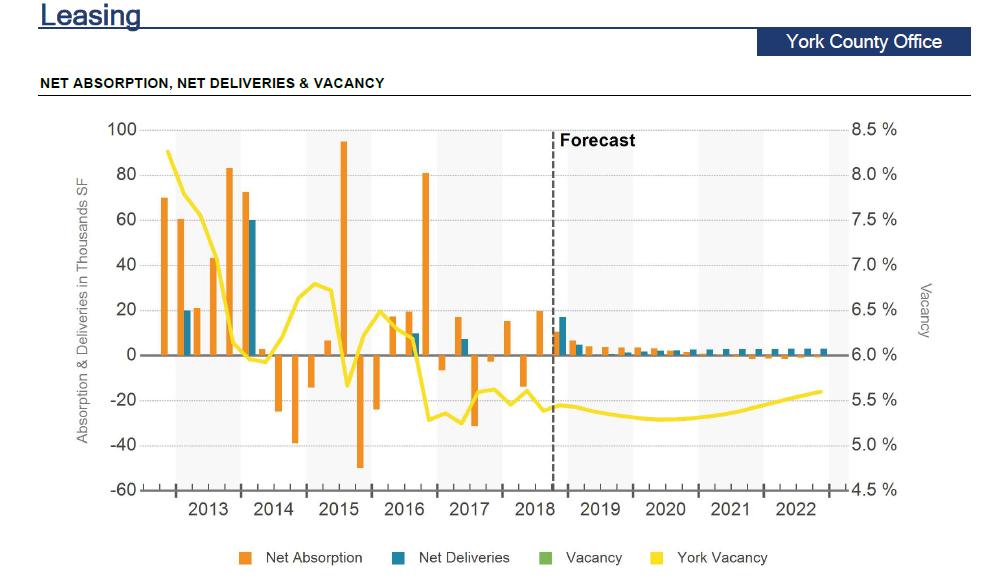
Rent Growth – The current 12 month rent growth is 1.6%. This is fairly close in line with the historical average of 1.1%, though the forecast average predicts that this will fall to 0.6%. For comparison, the peak in York’s rent growth occurred in Q3 2000 when it reached 6.8% and the trough was in Q3 2009 when it plummeted to -4.3%.

12 month deliveries in SF – York has a twelve-month delivery of 0 square-feet, compared to the historical average of 80,056 square-feet. The forecast average predicts that this rise to 13,093 square-feet. Additionally, 22,000 square-feet of office space is under construction, 17,000 square-feet of 4 and 5 star space and 5,000 square-feet of 3 star space, which will be delivered in coming quarters.
Key Takeaways
Overall, York County and Harrisburg East have been very stable. Not much is moving the needle. There is not a lot of absorption nor much new construction that could spur activity.
The real positive news from Q3 2018 is Lancaster County. This submarket rose above the rest for several reasons. First is its 324,000 square-feet in net absorption and 4.9% rent growth (highest since Q3 2003). Additionally the vacancy rate decreased 2.3%. Currently there are 81,840 square-feet under construction and 89,166 square-feet of new construction proposed.
In contrast, the Harrisburg West submarket is showing signs of distress. Its negative 282,000 square-feet of net absorption combined with a modest vacancy rate increase of 1.6% does not offer much hope for a major turnaround anytime soon. Additionally, the submarket has 86,400 square-feet of new office space under construction and 225,596 square-feet of proposed new space that the market will struggle to absorb, further driving down the net absorption.
Based on the activity taking place in Central Pennsylvania’s office real estate submarkets, how do you think this will impact business growth and development throughout these counties? How will this have a ripple effect into other areas of our economy?
Share your ideas by leaving a comment below!
 According to the data from the