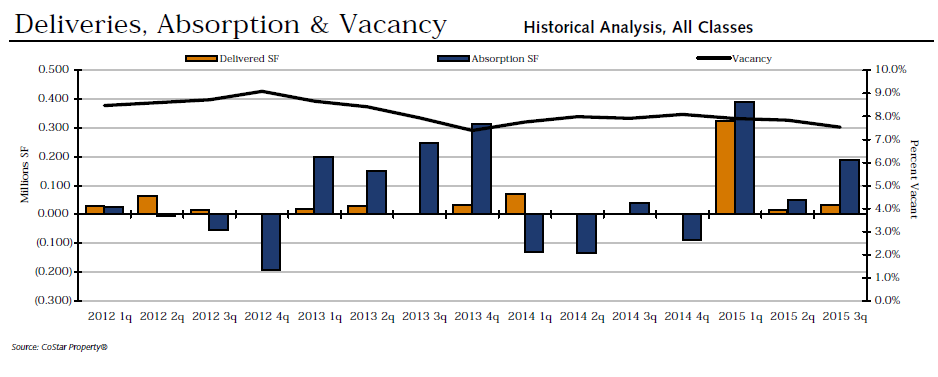
Overall, 2015 has proven to be an active and eventful year for Central PA office real estate. Six new buildings were delivered into the market with four more under construction. The vacancy rate rose slightly, but remains lower than it has been in recent years. Additionally, net absorption dropped by nearly 175,000 square-feet, though it still remains in the black.
How has this activity impacted the market? And how do we anticipate it will reflect on the local economy? Let’s first take a look at the numbers to help guide our predictions for the market’s performance in 2016 and beyond.
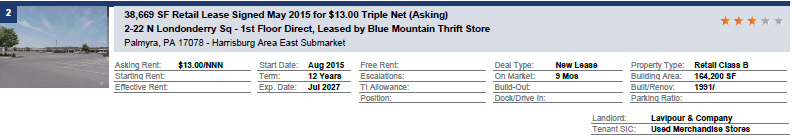
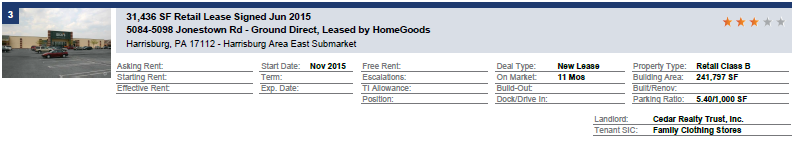
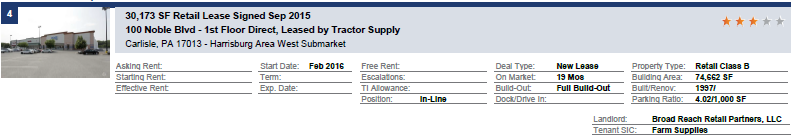
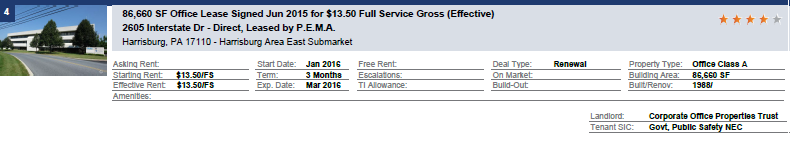
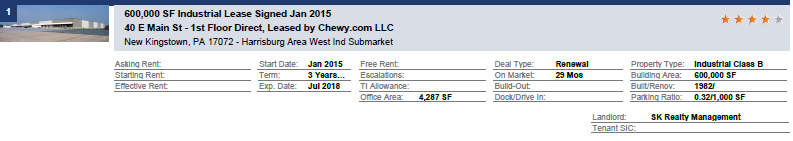
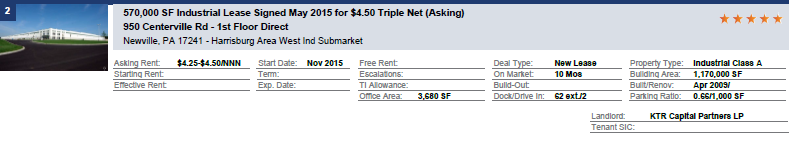
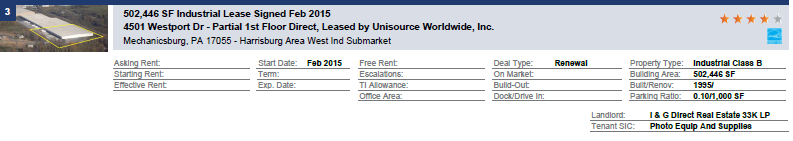
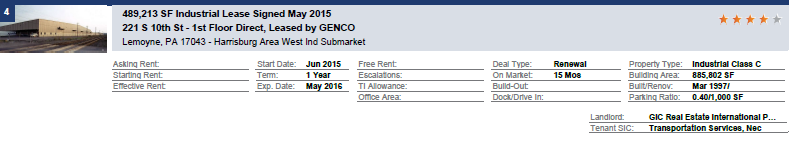
Select Year-to-Date Deliveries:
Six of the top 15 Select Year-to-Date Deliveries are within the Central PA submarket. Looking at just those that were delivered specifically in fourth quarter 2015, there are two worth noting. Coming in at number three on the CoStar list is the office building at 1250 Camp Hill Bypass. This building has an RBA of 82,000 square-feet and is 100% occupied. It broke ground in fourth quarter 2014 and was delivered one year later. Next is the Cornwall Health Center coming in at number five on the list. Located at 1701 Cornwall Road in Lebanon, this building has an RBA of 54,234 square-feet and is 100% occupied. This multi-million dollar project is estimated to bring a burst of new jobs to the area.
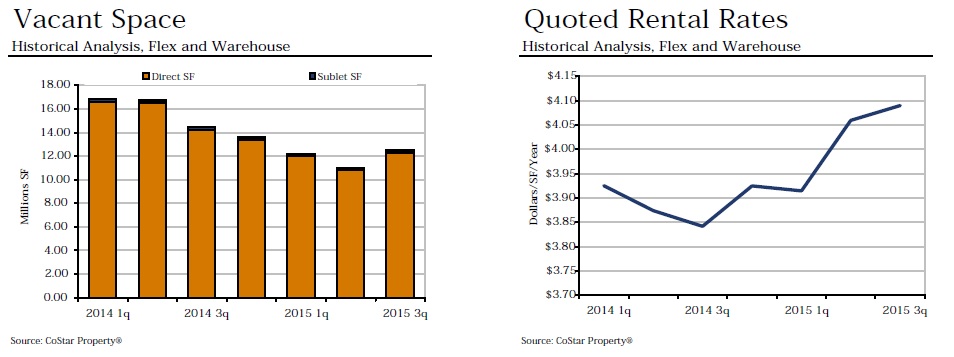
Vacancy:
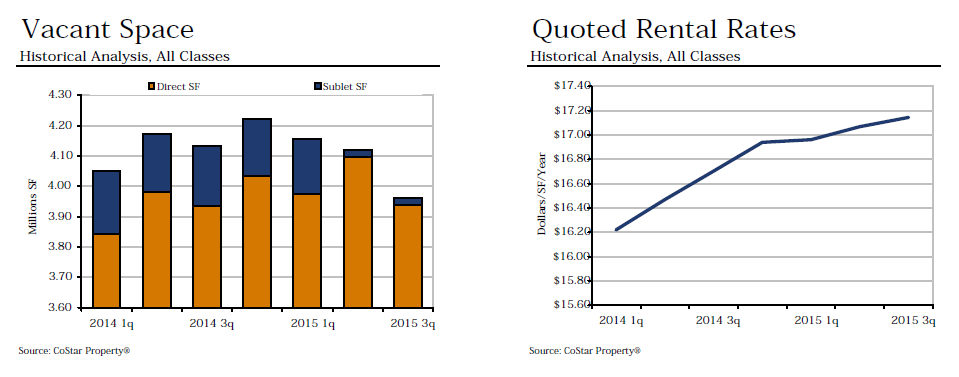
This quarter, we saw the vacancy rate rise ever so slightly from 7.5% to 7.7%. This returns the market closer to where it began the year, but is still lower than where we were one year ago at this time when the vacancy rate was 8.0%. Still, the overall trend is a decrease in vacancy rates. Comparatively to 2013 and prior, the vacancy rates were consistently at 8.0% or greater.
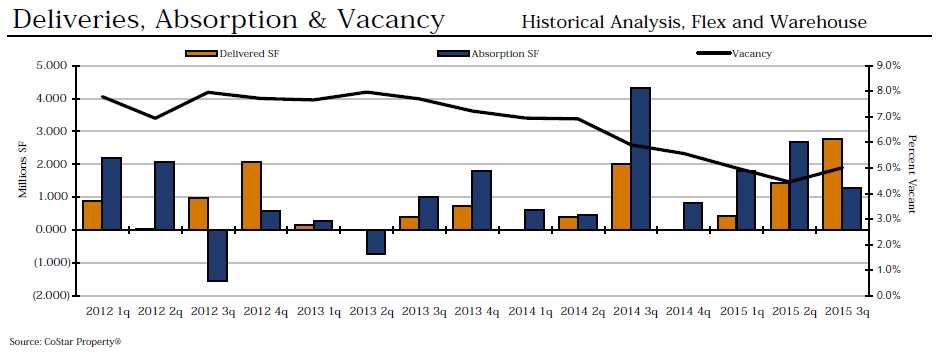
Absorption and Demand:
Net absorption took a major hit this quarter, dropping from 189,032 square-feet in Q3 to 15,921 square-feet in Q4. This is the lowest the absorption rate has been since one year ago at this time when it was negative 90,015. Overall, absorption rates in the Central PA office submarket have been volatile and hard to predict, often increasing or decreasing by more than 100,000 square-feet each quarter and dipping into the red a total of five times since Q1 2013.
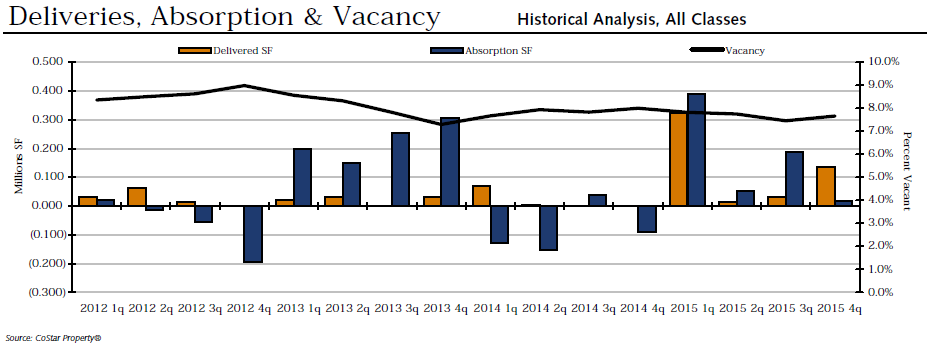
Image from CoStar
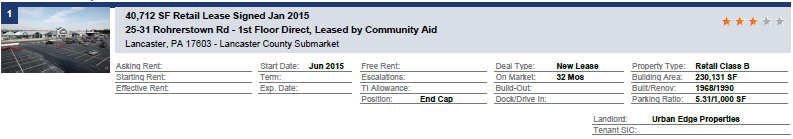
Rental Rates:
The quoted rental rates increased ever so slightly this quarter by $0.07 to $17.22. This continues a steady climb in rates that began at the start of 2013. Since that time, they have increased by a total of $1.11. This is also the highest rental rate we have seen in the Central PA submarket since prior to Q1 2012.
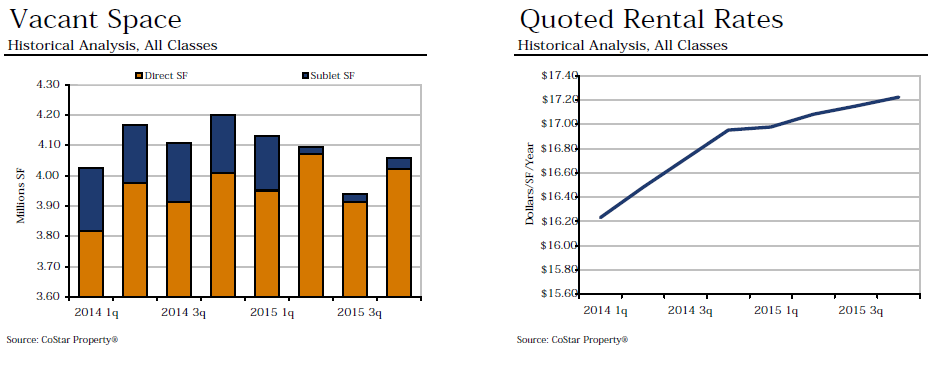
Image from CoStar
Our Summary/Analysis:
Looking to the future, we can expect even more square footage to be added to the local market in 2016 as four buildings, currently under construction, will be delivered between the first and third quarters. Combined, these new buildings will contribute 277,590 square-feet of office space. This will have an impact on nearly all aspects of the market including net absorption, existing inventory, delivered inventory and vacant square-footage.
As for the health and strength of the Central PA submarket, the seemingly ever-increasing rental rate is a sign that businesses are demanding more space and willing to pay for it. And with the majority of year-to-date deliveries and under-construction projects nearly fully occupied, new office space continues to be in-demand.
What fourth quarter 2015 market trend do you find most interesting or impactful? Share your insights by commenting below!

 According to the PA Manufacturers Association, manufacturing and its affiliated businesses contribute $11 Billion to the economy in south-central Pennsylvania alone, providing our community with an estimated 110,000 jobs. This industry is a huge part of our local economy and its growth impacts the growth of many other businesses.