OMNI Realty Group
  • Email
  • Facebook
  • Linkedin
  • Twitter
  • Rss
  • Home
  • Omni Advantage
    • Success Stories
    • Our Clients
    • Completed Deals
    • In the News
  • Services
  • Resources
    • Market Reports
    • Local Market
    • Office Space Calculator
    • CCIM Advantage
      • User Investment
      • CCIM Brochure
      • Total Expertise
      • Distinguish Yourself
      • How Would You Rate
  • Global Reach
  • Property Search
  • FAQ
  • Blog
  • Contact Us

Posts tagged "first quarter"

Home» Posts tagged "first quarter"

Central Pennsylvania Office Real Estate Made Few Gains in 2017

Posted on February 19, 2018 by Mike Kushner in Blog, Local Market, Office Leasing No Comments

Vacancy rates in the local office market remained mostly stagnant moving into the New Year.

If the saying “no news is good news” can be applied to Central Pennsylvania’s office real estate market, then 2017 was a good year indeed! We closed out 2017 with few noticeable gains and mostly stagnant vacancy and rental rates. On a positive note this means there were no lasting drops to cause volatility to the market; however, if “stagnant” remains an ongoing theme for our local office real estate market in 2018, we may have some cause for concern.

Let’s take a look at some key data for our three local submarket clusters: Harrisburg/Carlisle, Lancaster and York/Hanover. You will see that each experienced its own ebb and flow with some submarket clusters faring better than others at the close of fourth quarter 2017. The most important question to consider when looking at this data is: “What submarket is poised to perform the best in 2018 and what does that mean for commercial real estate and our local economy?”

Harrisburg/Carlisle Submarket Cluster

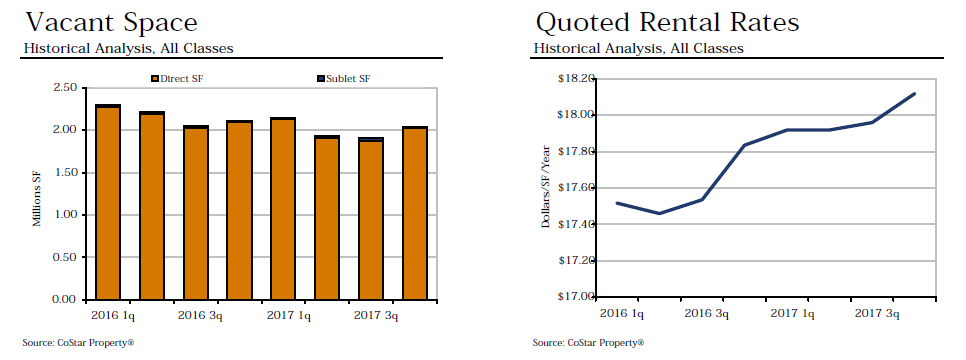
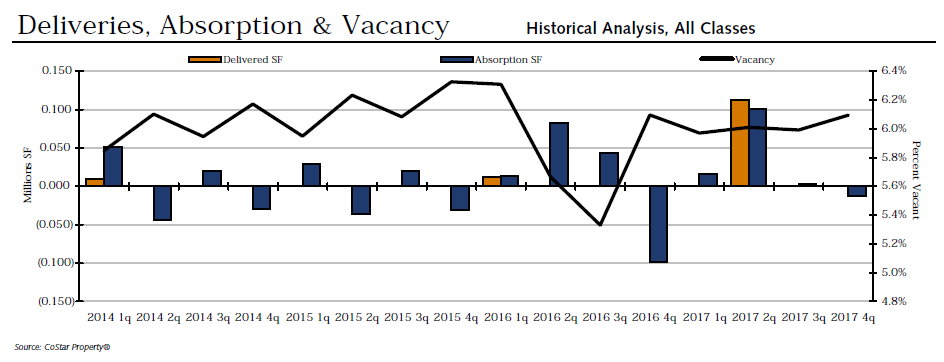
Vacancy – The office vacancy rate for the Harrisburg/Carlisle Submarket Cluster increased to 6.3% at the end of the fourth quarter 2017. The vacancy rate was 5.8% at the end of the third quarter 2017, 5.9% at the end of the second quarter 2017, and 6.5% at the end of the first quarter 2017, placing it just shy of where we began the year.

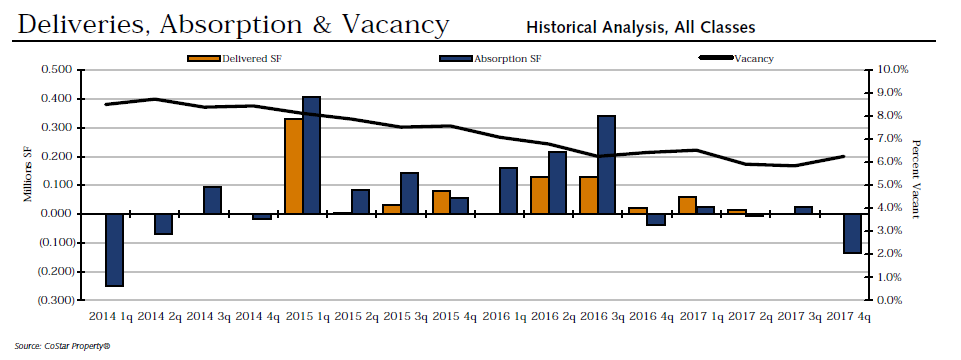
Absorption – Net absorption for the Harrisburg/Carlisle Submarket Cluster was a negative (135,877) square feet in the fourth quarter 2017. That compares to positive 25,603 square feet in the third quarter 2017, negative (6,036) square feet in the second quarter 2017, and positive 22,829 square feet in the first quarter 2017.

Largest Lease Signing – The largest lease signing occurring in 2017 was the 57,764 square foot lease signed by Pennsylvania Health and Wellness, Inc. at 300 Corporate Center Drive located in Camp Hill.

Rental Rates – The average quoted asking rental rate for available office space, all classes, was $18.12 per square foot per year at the end of the fourth quarter 2017 in the Harrisburg/Carlisle Submarket Cluster. This represented a .89% increase in quoted rates from the end of the third quarter 2017, when rents were reported at $17.96 per square foot.

Inventory – Throughout 2017, a total of two new office buildings were delivered to the market with a combined total of 73,000 square feet. At the close of the fourth quarter, two additional buildings remained under construction with a combined total of 70,000 square feet of inventory yet to be delivered.

Lancaster Submarket Cluster

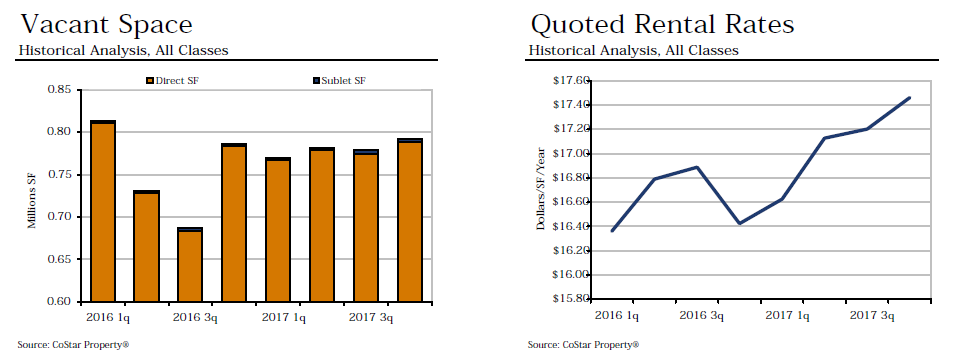
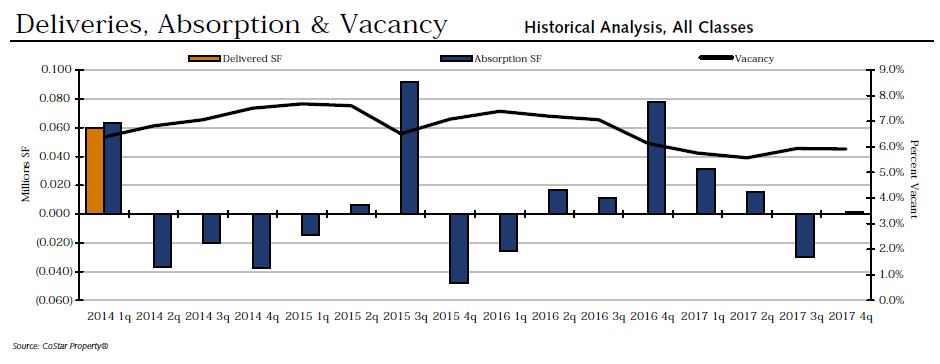
Vacancy – The vacancy rates for the Lancaster Submarket Cluster in 2017 held steady for the first three quarters at 6.0%. Only in fourth quarter 2017 did we see the slightest movement in vacancy to 6.1%. Since its dip to 5.3% in third quarter 2016, the vacancy rate has returned to its recent historical average where it continues to remain stable.

Absorption – In the fourth quarter of 2017, net absorption dropped into the negatives for the first time all year, ending 2017 at negative (13,391) square feet. Net absorption was 2,462 square feet in third quarter 2017, 101,013 square feet in second quarter 2017 and 16,187 square feet in first quarter 2017.

Rental Rates – Even with a drop in net absorption and only a slight increase in vacancy rates, the quoted asking rental rate for available office space, all classes, in the Lancaster Submarket Cluster continued to increase throughout 2017. In the first quarter the quoted rental rate was $16.63, $17.13 in the second quarter, $17.20 in the third quarter and $17.46 in the fourth quarter. This is the highest quoted rental the Lancaster Submarket Cluster has experienced since prior to 2014.

Inventory – Two new office buildings were delivered to the Lancaster Submarket Cluster in 2017. Both delivered in the second quarter and combined they added a total of 113,000 square feet of new office space.

York/Hanover Submarket Cluster

Vacancy – The fourth quarter office vacancy rate for the York/Hanover Submarket Cluster held steady at 5.9%, the same as it was in the third quarter. This is slightly higher than the 5.6% vacancy rate in the second quarter and the 5.8% vacancy rate in the first quarter.

Absorption – The fourth quarter ended with a net absorption of 1,400 square feet. This is an increase from the third quarter’s negative (29,853) square feet that was a significant drop from the second quarter’s 15,646 square feet the first quarter 2017’s 31,636 square feet. This is the only increase in net absorption the market experienced in 2017.

Rental Rates – 2017 started off with a fairly steady quoted asking rental rate for available office space, all classes, of $17.40 per square foot. It increased by $0.01 in the second quarter to $17.41 and spiked in the third quarter at $18.05. Though still higher than the first two quarters, 2017 finished with a slight dip in quoted rental rates as it fell to $17.74.

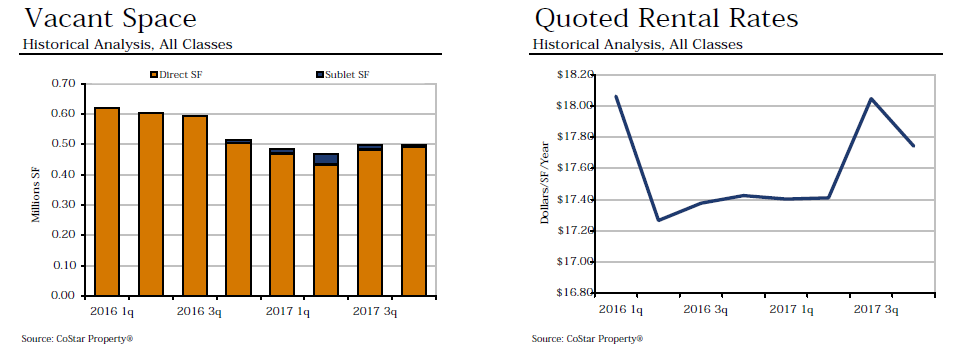
Inventory – No new office buildings were delivered in the York/Hanover Submarket Cluster in 2017. There is one building under construction with a total RBA of 840 square feet.

Looking at the comparison of the three Central Pennsylvania submarket clusters, which do you feel is in the best position to start making some moves in 2018? Share your ideas by leaving a comment below.

[Online Resources] Real Estate, 2017, 2018, carlisle, central pa, cluster, Commercial Real Estate, Economy, first quarter, fourth quarter, hanover, harrisburg, lancaster, mike kusher, office, Omni Realty, pennsylvania, rental rates, second quarter, submarkets, tenant representative, third quarter, trends, york

Central Pennsylvania Industrial Real Estate Report for Q1 2017

Posted on April 20, 2017 by Mike Kushner in Blog, Commercial Real Estate, Local Market, Trends No Comments

Region gains more than two million square feet of new industrial space in first quarter

2017 is on track to becoming one of the best years yet for industrial real estate in Central Pennsylvania – and we’ve only just wrapped up the first quarter! The market absorbed more than 2 million square feet of new space, while increasing net absorption and holding on to the highest rental rate per square foot that we’ve had in over four years. The vacancy rate also holds steady at 5.5%, even with an increase in vacant space.

The market almost can’t get its hands on space fast enough. Five of the six buildings delivered this quarter made it to CoStar’s Top 10 list. Additionally, nine new buildings are under construction and will deliver yet another 4,410,916 square feet of new space.

To see the full impact of the growth taking place in Central Pennsylvania’s industrial real estate market, take a look at the highlights from Q1 2017.

SELECT YEAR-TO-DATE DELIVERIES

Within the first quarter of 2017, Central Pennsylvania received six new industrial properties, totaling a combined 2,244,371 square feet of space. Five of these made it to CoStar’s list of Select Year-to-Date Deliveries. The first and largest is the Eden Road Logistics Center in York with 754,881 square feet of space. Next, Carlisle Distribution Center – Building 5 delivered 582,000 square feet of space. The Crossroads Logistics Center in Jonestown delivered 398,250 square feet of space. The property at 51 Commerce Drive – Building 1 in Reading delivered 339,200 square feet of space. And the property at 1451 Stoneridge Drive in Middletown contributed an additional 10,200 square feet of space.

SELECT TOP UNDER CONSTRUCTION PROPERTIES

If six new properties delivering in the Q1 wasn’t enough to prove the rapid growth of industrial real estate in Central Pennsylvania, there are yet nine more properties under construction, four of which made it to CoStar’s list of Select Top Under Construction Properties. A 1.1 million square-foot property located at 100 Fry Drive, Mechanicsburg is expected to deliver in Q3. A 1,002,000 square-foot property located at 575 Old Forge Road, Jonestown is also expected to deliver in Q3. The Goodman Logistic Center Carlisle – Building 2 will deliver 938,828 square feet of space in Q2. Finally, Orchard Business Park II – Building A will deliver 780,000 square feet of space in Q4.

SELECT TOP SALES

Among the year’s select top sales, are three worth noting that took place in Central Pennsylvania. The Ames True Temper building in Carlisle (1,226,525 square feet) sold for $90,150,000 to Clarion Partners. Target Distribution Center in York (785,400 square feet) sold for $60,000,000 to AEW Capital Management. And the building at 100 Louis Parkway in Carlisle (400,596 square feet) sold for $28,850,000 to Industrial Property Trust.

ABSORPTION

2017 is setting records all around for industrial real estate in Central Pennsylvania. Q1 boasts the largest number of buildings in existing inventory (3,635) and the largest total RBA (262,658,186 square feet) we have ever seen. In less than four years, the local market gained 45 new buildings, with nine more under construction. Even with all of this new inventory entering the market, net absorption continues to increase, proving the demand for more space. Net absorption this quarter rose from 992,800 square feet to 2,107,328 square feet. This is the highest net absorption we’ve seen since Q2 2015 and the third highest since it plummeted into the negatives in Q2 2013.

VACANCY & RENTAL RATES

Total vacant space increased from 14,255,260 square feet to 14,392,303 square feet this quarter. Even with this increase, the vacancy rate holds steady at 5.5%, where it’s been since Q2 2016. The quoted rental rate also remains steady at $4.36. This is the highest price per square foot we’ve seen prior to Q2 2013, again proving a healthy demand for industrial real estate in Central Pennsylvania!

What trend from the first quarter did you find most interesting or impactful to Central Pennsylvania industrial space? Share your insights by leaving a comment below.

Learn more from past market reports:

Central Pennsylvania CRE Market Reports Q4 2016

Predictions for Trends and Changes in Commercial Real Estate in 2017

Influx of New Construction Impacts Central PA’s Industrial Real Estate Market

[Online Resources] Real Estate, central pennsylvania, Commercial Real Estate, Construction, costar, CRE, demand, expert, facts, first quarter, industrial, market report, Mike Kushner, more space, new space, Omni Realty Group, pennsylvania, space, statistics, supply, trends, vacancy

First Quarter Yields Positive Net Absorption, Not Much Else for Office Space in Central PA

Posted on July 14, 2015 by mike.kushner in Blog, Local Market, Trends No Comments

If no news is good news, then the Q1 market report for Central Pennsylvania office space is very good news indeed. The waters remain calm – though not completely stagnant – for the local market.

With merely one year-to-date delivery and a vacancy rate that has only moved one-tenth of a percentage point or so since 2013, office space has been consistent and predictable. There are several important conclusions we can draw from the following data and how it relates to the current health of the market and predictions for future growth, but let’s first begin by breaking down the numbers and taking a closer look at the facts:

Select Year-to-Date Deliveries:

The Central Pennsylvania submarket has delivered one property so far in 2015. Located at 13 Adams Drive, Conestoga Oral and Maxillofacial Surgery will use most of the 10,000 square feet in this facility. The quoted rental rate is $22.58 and the building is 70% occupied.

Vacancy and Availability:

Vacancy has remained nearly unchanged throughout First Quarter 2015. Only one new building was delivered contributing 10,000 square feet of office space. Vacant square-feet fell ever so slightly from 4,266,826 in Fourth Quarter 2014 to 4,219,233 this quarter. This moved the vacancy % just one-tenth of a point down to 8.3% – a rate that has remained relatively unchanged since Fourth Quarter 2013.

Deliveries, absorption and vacancy

Absorption and Demand:

In First Quarter 2015 we did see net absorption move back into positive numbers. Ending Fourth Quarter 2014 at negative 88,815 square-feet, this number jumped to 57,593 square-feet which is the highest for Central Pennsylvania since Fourth Quarter 2013.

Rental Rates:

The quoted rental rates for First Quarter 2015 rose $0.03 to an average rate of $17.18 per square-foot. While this increase in price is not a huge jump, it was enough to push the quoted rental rate in the Central Pennsylvania submarket to the highest it has been since Fourth Quarter 2011.

vacant space

Our Summary/Analysis:

The Central Pennsylvania submarket has seen very little growth over the last 15 quarters.  Total rentable building area (RBA) has increased by only 1.2%.  The vacancy rate has averaged 8,4% (with a high of 9.2% and a low of 7.5%) and rental rates have averaged $16.78 per SF (with a high of $17.42 per SF and a low of $16.26 per SF).  Although the economic indicators are improving, we don’t expect any significant new construction growth. Vacancy and rental rates should remain stable

How has office real estate in Central PA personally impacted you? Or how does this compare to the First Quarter you experienced in your own local market? Join in the conversation by commenting below!

[Online Resources] Real Estate, absorption, business, central pa, central pennsylvania, commercial, costar, Economy, first quarter, local, Mike Kushner, office, Omni Realty, q1, rent, report, space, vacancy

Harrisburg’s Retail Real Estate Hits Record Low Net Absorption in Q1

Posted on June 2, 2015 by mike.kushner in Blog, Commercial Real Estate, Local Market, Trends No Comments

The Central Pennsylvania retail real estate submarket closed First Quarter 2015 with some good news and some bad news. On a positive note, the quoted rental rate is the highest it has been in nearly four years. However, this data is quickly overshadowed by the submarket’s negative net absorption which plummeted 316,783 square feet in a single quarter. Most concerning is how Harrisburg Area East has appeared to bear the brunt of this drop.

So what has gone on in the local retail real estate market this past quarter? And what could be the cause of this major shift in net absorption? Let’s first take a look at what the numbers are saying and then apply them to what this means for the health of the market.

Top Under Construction Properties:

The Central Pennsylvania submarket has two retail properties that are under construction that are among the Top 15 for First Quarter 2015. Coming in at number six, Messina Highlands has an RBA of 30,000 square-feet and is 45% preleased. This property is expected to be delivered in Second Quarter 2015.  Number 15 on the list is a property located at 108 Pauline Drive in York, Pennsylvania. This is expected to deliver an RBA of 7,200 square-feet in Fourth Quarter 2015 and is not preleased.

Select Top Retail Leases:

Out of the Select Top Retail Leases that were signed in First Quarter 2015, there were two Central Pennsylvania properties that made it to the top 10. Coming in at number three, the 46,158 square-foot Toy “R” Us, located in Harrisburg Area West was leased by an unlisted tenant. At number seven, a 14,976 square-foot property located at 611 N. 12th Street in Harrisburg Area East was leased by Save-A-Lot.

Vacancy and Availability:

First Quarter 2015 closed with 4,799,169 square-feet of vacant space. The vacancy % jumped from 5.7% last quarter to 6.0% this quarter. It appears the dip we saw in this number throughout Second, Third and Fourth Quarter 2014 is returning to its higher average in the 6’s, but not nearly as high as it was two years ago at this time. No new buildings were delivered in this quarter, so the total RBA stays put at 60,315,522 square-feet.

Del, Abs and Vac Q1 205 Retail

Absorption and Demand:

The net absorption was the biggest shift we saw in First Quarter 2015. Last quarter ended with a positive 62,480 square-feet, but this number since dropped to negative 254,303 square-feet. This is by far the lowest number we have seen in the Central Pennsylvania retail market in nearly four years. The closest comparison was back in Second Quarter 2012 with a negative net absorption of 49,528 square-feet – but still far off from where we are now.

Looking specifically at Harrisburg Area East, this submarket experienced a negative net absorption of 237,665 square-feet. In comparison to the rest of the submarket, Harrisburg Area West maintained a positive net absorption of 45,041 square-feet as well as York County with 48,431. The rest of the Central Pennsylvania submarket closed the Quarter with a negative net absorption, but not nearly as low as Harrisburg Area East. Adams County ended with negative 3,672 square-feet; Lancaster County ended with negative 98,938 square feet; and Perry County ended with negative 7,500 square-feet.

Rental Rates:

The quoted rental rate for First Quarter 2015 is $11.51. This is a mere penny increase from the previous quarter, which is just enough to bring it to the highest rate we have seen in Central Pennsylvania’s retail real estate market in nearly four years.

Vac space and quoted rental rates Q1 205 Retail

Our Summary/Analysis:

In some markets, retailers that are back in expansion mode are bumping up against a big obstacle – a lack of inventory when it comes to good real estate locations. The limited supply of new retail construction has been a huge help to improving absorption and vacancies. However, the Harrisburg East Submarket which is part of the Central Pennsylvania Submarket Cluster (including Adams, Cumberland, Dauphin, Lancaster, Perry and York counties) struggled in Q1 2015.  The major contributors were the closing of a Sears store in the Lebanon Plaza Mall and the Kmart at 2090 Lincoln Highway in Lancaster.

Sears Holdings Corporation, the company that runs Sears and Kmart, has a problem. They have a lot of real estate and not enough sales to keep all that real estate busy. As a result, they are forced to close stores that underperform or as their leases expire. In buildings they own or hold long-term leases, they often opt to rent out space to other businesses to try and minimize expenses as much as possible.

Harrisburg East experienced an unfortunate setback in Q1, but as a whole, the Central Pennsylvania submarket’s economic health looks hopeful for the remaining quarters. It’s important that we continue to watch other Sears Holdings Corporation’s real estate locations as well as any other big businesses that are struggling and closing retail locations as a result.

What other trends in the retail real estate market have you seen take place in First Quarter 2015? Share your insights by commenting below!

[Online Resources] Real Estate, 2015, absorption, adams county, availabilty, camp hill, central pennsylvania, Commercial Real Estate, Construction, demand, east, Economy, first quarter, forecast, harrisburg, health, lancaster, leases, lebanon, mechanicsburg, Mike Kushner, news, Omni Realty, pa, q1, report, retail, trends, vacany, west, york

First Quarter 2015 Shows Growing Industrial Real Estate Market in Central PA

Posted on May 4, 2015 by mike.kushner in Blog, Commercial Real Estate, Local Market, Trends No Comments

Industrial real estate in Central Pennsylvania is off to a strong start this year! In First Quarter 2015, we have seen signs of positive growth that has the momentum to make this year one of the best in a while for the market.

Central Pennsylvania gained three newly built properties that were delivered in this quarter alone. Combined, they added an additional 1,564,560 square-feet. This growth was met by a strong demand as the vacancy rate dropped and the quoted rental rate did not waver from its two-year-high it rose to last month. And that’s not all!

To better understand what this means for the local industrial real estate market now and into the future, let’s take a closer look at what the numbers are saying and how they stack up against the performance of past quarters.

Top Select Year-to-Date Deliveries:

Three of the top 8 Select Year-to-Date Deliveries occurred in the Central Pennsylvania submarket. Number one on the list is the Urban Outfitters Gap Distribution Center 2 that has an RBA of 1,140,000 square-feet and is 100% occupied. Third on the list is Capital Logistics Center, Building 200 that has an RBA of 400,060 square-feet, but is not occupied at this time. The final Central Pennsylvania industrial space on the list, coming in at number 8, is “8 Brooks Avenue” that has an RBA of 24,500 square-feet and is not occupied at this time.

Top Under Construction Properties:

Additionally, three of the top five Select Top Under Construction Properties are located in the Central Pennsylvania submarket. Number one on the list of ProLogis Shippensburg with an RBA of 1,400,000 square-feet, is 100% pre-leased and is expected to be delivered in Fourth Quarter 2015. Second on the list is Nordstrom Distribution Center with an RBA of 1,142,000 square-feet, is 100% pre-leased and is expected to be delivered in Third Quarter 2015. Finally, number five on the list is ProLogis Park Carlise II – Building I with an RBA of 1,029,600 square-feet, is not pre-leased and is expected to be delivered in Third Quarter 2015.

Vacancy and Availability:

The first quarter of the New Year ended with 13,928,491 square-feet of vacant industrial space in the Central Pennsylvania submarket and a vacancy rate of 5.6%. This is a decrease from the 14,772,913 square-feet of vacant space and 6.0% vacancy rate we saw in Fourth Quarter 2014. Additionally these are the lowest numbers we have seen since before Second Quarter 2011.

Three new building were delivered this quarter increasing the total RBA from 246,152,030 square feet in Fourth Quarter 2014 to 247,716,590 square feet. This is the highest total RBA (and largest number of buildings) the market has seen since before Second Quarter 2011.

Del, Absorp and Vac

Absorption and Demand:

In First Quarter 2015, the industrial market in Central Pennsylvania experienced a positive net absorption of 2,408,982 square-feet. This is a healthy jump from the 689,636 square-feet we saw in Fourth Quarter 2014 and we are getting closer to the 3+ year record high net absorption of 3,953,706 square-feet that we experienced in Third Quarter 2014.

vacant space, quoted rental rates

Rental Rates:

This quarter’s quoted rental of $3.94 did not budge a cent from where it left off in Fourth Quarter. This is good news for the market because it is the highest quoted rental rate the Central Pennsylvania industrial commercial real estate submarket has experienced in two years.

Our Summary/Analysis:

Looking forward into 2015, there are multiple developers who are commencing speculative projects ranging from 200,000SF to 1 MSF+. If all of the proposed projects commence, there will be approximately fifteen new projects totaling over 11MSF.  The actual number of speculative projects will likely be impacted by the leasing activity during the first half of the year. We anticipate that demand will absorb a significant quantity of the new product with only a modest rise in vacancy.

The continuing economic recovery, ongoing evolution of e-commerce and resurgence in domestic manufacturing have generated resiliency in the industrial sector. Trends in industrial real estate supply and demand are favorable in the Central Pennsylvania market. We expect that the shifting demand and service paradigms, demographic market forces and global dynamics will support continuing growth in industrial real estate.

What other trends in commercial real estate have you seen take place in First Quarter 2015? Share your insights by commenting below!

[Online Resources] Real Estate, 2015, absorption, blog, camp hill, central pa, commercial, first quarter, harrisburg, industrial, lancaster, local, market, mechanicsburg, Mike Kushner, Omni Realty, pennsylvania, percent, prediction, rate, rental, report, trends, vacancy, york

Subscribe To Our Blog

  • This field is for validation purposes and should be left unchanged.

Mike J Kushner, CCIM

  • Contact me for a FREE Lease Review!
  • This field is for validation purposes and should be left unchanged.

Categories

  • About Us
  • Blog
  • CCIM
  • Commercial Real Estate
  • Community
  • Construction
  • CPBJ Articles
  • CREDC Articles
  • Feature
  • Featured Opportunities
  • Guest Blogger
  • Healthcare
  • In the News
  • Industrial
  • Local Market
  • Office Leasing
  • Retail
  • Success Stories
  • Tenant Representative/Buyer Agent
  • Trends

(c) 2019 OMNI REALTY GROUP- Website Design by The John Webster Company