OMNI Realty Group
  • Email
  • Facebook
  • Linkedin
  • Twitter
  • Rss
  • Home
  • Omni Advantage
    • Success Stories
    • Our Clients
    • Completed Deals
    • In the News
  • Services
  • Resources
    • Market Reports
    • Local Market
    • Office Space Calculator
    • CCIM Advantage
      • User Investment
      • CCIM Brochure
      • Total Expertise
      • Distinguish Yourself
      • How Would You Rate
  • Global Reach
  • Property Search
  • FAQ
  • Blog
  • Contact Us

Posts tagged "costar"

Home» Posts tagged "costar"

Central PA’s Top Commercial Real Estate Leases in 2020

Posted on February 22, 2021 by Mike Kushner in Blog, Commercial Real Estate, Industrial, Local Market, Office Leasing, Trends No Comments


In spite of 2020’s black swan event (COVID-19), leasing activity in Central Pennsylvania continued with mixed results. Normally insulated from strong economic downturns, the coronavirus tested the Central Pennsylvania Region and there are reasons for both concern and optimism.

On the negative side: massive job losses in retail and a significant manufacturing base could cause serious disruption. Roughly 30,000 people were employed in the retail sector in March, and close to that number were also employed in manufacturing. Though manufacturing’s future remains less clear and the market could be buoyed by the region’s deep presence of food production, retail has been hard hit by the shutdown.

While being the state’s capital will provide some shelter in the coming months, Pennsylvania’s fiscal situation is a mess. Financial troubles could portend future government layoffs and by the third quarter, the state had already cut 2,500 government jobs.

There’s little chance the economy doesn’t cool in Central Pennsylvania but the market does have some factors working in its favor. BLS data shows the market has lost about 5% of its total non-farm employment levels since March. While this is obviously a significant reduction, it does compare well with nearby Lehigh Valley and Pittsburgh. While Harrisburg’s demographic gains won’t raise any eyebrows, the region does stand out in Pennsylvania. Cumberland County is one of the fastest-growing counties in the state, likely aided by the growing logistics and warehouse presence along the Carlisle Corridor.

The logistics sector is expected to hold up well and perhaps even grow as e-commerce continues its acceleration. An Adobe report from June showed that online spending was up 77% year over year, representing growth in e-commerce that experts were not forecasting the country to reach until 2026. Central Pennsylvania’s location is prime for shipping, and such a scenario could lead to more jobs and perhaps fuel additional growth in population.

Additionally, Central Pennsylvania is also trying to evolve into a knowledge-based economy and has adopted business-friendly incentives that have helped create nearly two dozen tech startups, which have generated 1,000 jobs. Education and health services jobs, which now track evenly with government jobs in the state’s capital, grew by more than 4% annually.

How does the ever-shifting economy impact the commercial real estate market, particularly as it pertains to commercial leases?

It comes as no surprise that industrial real estate leases in 2020 carried the largest square footage, with the top lease coming in at more than 1.1M SF to Lowes Distribution Center in Shippensburg. Additionally, Bob’s Discount Furniture will be moving into the former Best Buy in Lancaster, and Hershey will be getting a new Big Lots in the Hershey Square Shopping Center. The top five flex leases also provided businesses with hundreds of thousands of Class B Flex Space. Keep reading to view the top 5 leases from 2020 for office, retail, industrial, and flex space.

Top 5 Office Leases

#1 – 1929 Lasalle Ave – Bldg 134, Lancaster, PA 17601

High Associates Ltd. leased out the 29,000 SF Class C Office Building built in 1974 to Equipment Depot beginning in January of 2020 for a 1-year term. It had previously been vacant for 164 months.

#2 – 1803 Mt Rose Ave – Bldg B, York, PA 17403

Kinsley Properties leased out the 23,704 SF Class C Office Building built in 1988 to IDS, LLC beginning in February of 2021 for a 5-year term. It had previously been vacant for 13 months.

#3 – 990 Peiffers Ln – NRG Engine Services, Harrisburg, PA 17109

Campbell Commercial Real Estate leased out the 23,382 SF Class B Office Building built in 1987 to UPS Midstream Services Inc. beginning in February of 2020 for an unspecified term.

#4 – 1770 Hempstead Rd – Greenfield Corporate Center, Lancaster, PA 17601

High Associates Ltd. leased out the 16,088 SF Class B Office Building built in 1990 to an unnamed leasee beginning in November of 2020 for unspecified term. It had previously been vacant for 19 months.

#5 – 200 Corporate Center Dr – 200 Corporate Center Dr, Camp Hill, Camp Hill, PA 17011

Cushman & Wakefield leased out the 11,655 SF Class A Office Building built in 1986 to an unnamed leasee in August of 2020 for an unspecified term. It had previously been vacant for 52 months.

Top 5 Retail Leases

#1 – 3975 Columbia Ave, Columbia, PA 17512

The 86,100 SF Class B Retail Building built in 1992 was leased to U-Haul, as the single tenant, beginning in June of 2021.

#2 – 1801 Hempstead Rd – Former Best Buy, Lancaster, PA 17601

Bennett Williams Commercial and ShopCore Properties leased out the 45,915 SF Class B Retail Building built in 2009 to Bob’s Discount Furniture beginning in September of 2020 for a 10-year term. It had previously been vacant for 23 months.

#3 – 921 E Main St – Mount Joy Square Shopping Center, Mount Joy, PA 17552

Bennett Williams Commercial leased out the 44,761 SF Class B Retail Building built in 1989 to an unnamed business beginning in March of 2021. It had previously been vacant for 25 months.

#4 – 1130-1170 Mae St – Hershey Square Shopping Center, Hummelstown, PA 17036

Bennett Williams Commercial leased out the 38,202 SF Class B Retail Building built in 1994 to Big Lots beginning in June of 2020 for a 10-year term. It had previously been vacant for 12 months.

#5 – 4075 E. Market St – York, PA 17402

The Flynn Company leased 27,000 SF Class C Industrial/Manufacturing Building built in 1972 to No Piston, LLC beginning in October of 2020 for a 5-year term.

Top 5 Industrial Leases

#1 – 1 Walnut Bottom Rd – Shippensburg 81 Logistics Center, Shippensburg, PA 17257

Colliers International leased out the 1,100,500 SF Class A Industrial Building completed in 2020 to Lowes Distribution Center beginning in February of 2021. It had previously been a vacant shell space for 160 months.

#2 – 200 Goodman Dr – Building 2, Carlisle, PA 17013

CBRE leased out the 938,828 SF Class A Industrial Building built in 2017 to Syncreon beginning in December 2020. It had previously been vacant for 44 months.

#3 – 951 Centerville Rd – Penn Commerce Center – Building A, Newville, PA 17241

Cushman & Wakefield leased out the 807,998 SF Class A Industrial Building to an unnamed leasee. It had previously been vacant for 5 months.

#4 – 4875 Susquehanna Trl – ES3 LLC Bldg 1, York, PA 17406

The 790,042 SF Class B Industrial Building was leased to ES3, a Professional, Scientific, and Technical Services company, beginning in February 2020 for an unspecified term.

#5 – Centerville Rd – Penn Commerce Center – Building B, Newville, PA 17241

Cushman & Wakefield leased out the 753,000 SF Class B Industrial Building to an unnamed lease beginning on January 2021. It had previously been vacant for 3 months.

Top 5 Flex Leases

#1 – 60-64 Industrial Rd, Elizabethtown, PA 17022

Cushman & Wakefield leased out the 113,720 SF Class B Flex Space completed in 1992 to WillScot beginning in September of 2020. It had previously been a vacant shell space for 13 months.

#2 – 1740 Hempstead Rd – Building 380, Lancaster, PA 17601

High Associates, Ltd. leased out the 34,000 SF Class B Flex Space completed in 1964 to an unnamed business beginning in January of 2021. It had previously been a vacant shell space for 92 months.

#3 – 6400 Flank Dr, Harrisburg, PA 17112 – Harrisburg Area East Ind Submarket

NAI CIR leased out the 32,212 SF Class B Flex Space completed in 1987 to an unnamed business beginning in June of 2020. It had previously been a vacant shell space for 3 months.

#4 – 1000 Kreider Dr – Building A, Middletown, PA 17057

CBRE leased out the 12,030 SF Class B Flex Space completed in 2006 to an unnamed business beginning in August of 2020. It had previously been a vacant shell space for 8 months.

#5 – 3545 Marietta Ave – Silver Spring Center, Lancaster, PA 17601

Prospect Leasing & Management leased out the 7,192 SF Class B Flex Space completed in 1997 to an unnamed business beginning in January of 2021 for a 5-year term. It had previously been a vacant shell space for 6 months.

With so much square footage having exchanged hands in Central PA in 2020, it will be interesting and important to keep an eye on how these businesses impact the region. There were quite a few properties that made it to this list that had sat vacant for years. Now with new tenants, this will drive jobs and contribute to the local economy. And with some of these leasing terms for 5, even 10 years, these businesses have made a commitment to being here long-term.

Among all the top leasing deals that took place in 2020, which sector – office, retail, industrial, or flex – do you think will have the largest and most immediate impact on the Central PA region? Share your thoughts by leaving a comment below.

*Data of the top commercial real estate sales provided by CoStar.

[Online Resources] Real Estate, business, carlisle, Commercial Real Estate, costar, CRE, data, deal, development, Economy, gettysburg, growth, hanover, hershey, jobs, lancaster, lease, Leasing, lebanon, mechanicsburg, Omni Realty Group, pennsylvania, property management, retailers, tenant representative, trends, warehouse, york

How Central PA’s Growing Population Impacts Local Businesses

Posted on October 25, 2019 by Mike Kushner in Blog, Local Market, Trends No Comments

According to a 2018 report from the Pennsylvania Data Center, Pennsylvania’s population is expected to grow approximately 1% from the 2010 to the 2020 population, which is 1% better than no growth or a loss. What’s even more remarkable, is Pennsylvania’s growth is focused in about 16 counties, 14 of which are in Pennsylvania’s South Central Region, South East Region and Lehigh Valley, including Pennsylvania’s fastest growing county population in our own Cumberland County, here in South Central PA.

Furthermore, estimated population growth in those 14 counties is about 3.8%, which is driving Pennsylvania’s overall modest population growth, while counties in Pennsylvania’s West and Northern Tier are losing population with only Butler and Centre Counties showing expected population growth.

All of this data raises a very important question…

How does Central Pennsylvania’s changing population stand to impact the economic development of our local businesses?

To help answer this, we asked David Black, President and CEO of the Harrisburg Regional Chamber and CREDC, to weigh in from his perspective and the changes he is seeing taking place in Central Pennsylvania. Here is what he shared.

***

Focusing on South Central Pennsylvania, which includes Adams, Cumberland, Dauphin, Franklin, Lancaster, Lebanon, Perry and York, it’s pretty good news for us. Population growth drives demands for products, services and community amenities – quality of life factors. The quality of life factors – everything from good restaurants, entertainment, quality public education, exceptional health care, transportation access and cost of living – are in part driven by more people paying more taxes and needing more services that feed into our positive economic cycle.

Given our region’s transportation advantage via highways, rail and air and other amenities, South Central Pennsylvania is a great place to live, raise a family and have fun, plus we are close enough that if large metros like Washington, Baltimore, Philadelphia or New York is your thing, just a few hours will get you there. Quality of life issues help to attract and retain workforce, which is the business community’s number one issue these days, due largely to the fact that 10,000 baby boomers nationwide are retiring each and every day, leaving workforce challenges in many industries.

People want to live in vibrant communities. Some people prefer urban lifestyles, some are suburbanites while still others prefer the more natural rural lifestyles. Guess what? South Central Pennsylvania has it all. You can live on your 10 acres in Perry County and be to work in 30 minutes in downtown Harrisburg or walk to your job in center city Harrisburg from your apartment downtown, or your own home in Midtown, or commute 10 or 15 minutes from your suburban community to your job.

Population growth helps to drive business growth, it helps to drive additional growth in our region. While we think of ourselves as Harrisburg or Lancaster or York, commuting patterns show us that people commute from county to county to work because they can. I have a theory, with no disrespect to Lebanon County, that everyone in the Palmyra area actually works in Dauphin County at someplace with Hershey in the name! Businesses provide jobs, but people with the ability to spend drive local economies while our strategic location and transportation advantage help to connect us to the global economy and make South Central Pennsylvania such a special place to call home.

***

To offer additional insight, specifically on working age population growth in Pennsylvania, we asked Ben Atwood of CoStar, a national commercial real estate research firm.

***

One of Costar’s recent articles entitled “Latest Census Data Shows Lehigh Valley Leading Pennsylvania in Working-Age Population Growth” stated that the latest data from the Census Bureau shows Pennsylvania continues struggling to lure in new industries and working age residents. The U.S. population aged 20-64 increased by 0.25% last year, but of Pennsylvania’s 67 counties, only seven surpassed this growth rate and 55 experienced net declines.

Harrisburg and its satellite markets are pretty underdeveloped (excepting Lancaster), relatively speaking. And the lack of modern office supply and relatively stagnant population growth means there likely won’t be major companies relocating into the area. Right now, that capital investment would have to be largely local, and how much are people locally willing to risk?

Central PA is in the position to grow in ways other areas in the state aren’t, but that doesn’t mean that growth will be rapid, or even guaranteed. The new developments will be riskier, hampering investor interest. This combined with stagnant, even waning growth in working age population can be cause for concern both near and long-term.

To some extent, the optimism about population growth is misplaced because it could just mean these areas will have a slightly easier go of it over the next few decades, as automation continues to eat away at blue collar jobs in retail, shipping, and professional services in the Commonwealth’s smaller markets.

Things change and evolve, and no one can predict the future, but a lot of growth in these areas is in transportation and manufacturing, industries with long term automation risks, and there’s plenty of reasons to believe automation will expand into white collar employment in the near future.

***

Omni Realty Group is very grateful for David and Ben’s expertise and input. It’s fascinating, yet not surprising that population growth can have such a profound impact on quite literally everything else. Here in Central Pennsylvania we have a valuable opportunity to harness this growth and use it to fuel our economy. This further emphasizes the point that there are many unique benefits to live, work, and play in this region. Whether you call Central Pennsylvania home, are employed in the region, or simply enjoy visiting to experience its social offerings, you are playing an important role in the growth of our economy.

How else do you feel that our region’s changing population stands to impact local businesses? Join in the conversation by leaving a comment below.

[Online Resources] Real Estate, analysis, ben atwood, blog, business, carlisle, census, central pa, central pennsylvania, Commercial Real Estate, costar, CRE, data, david black, development, Economy, growth, guest blogger, harrisburg, Harrisburg regional chamber, hershey, lancaster, local, market report, Omni Realty Group, pennsylvania, population, real estate broker, regional, tenant representative, trends, york

Power Landlords: Who Owns the Most Office Space in Central PA?

Posted on May 30, 2019 by Mike Kushner in Blog, Commercial Real Estate, Local Market No Comments

These are buildings that you have likely passed countless times. Whether you live in Central Pennsylvania, or any other part of the world, real estate is all around us. Have you ever stopped to wonder who owns a particular piece of real estate? Maybe it’s the not the first question you’re asking on your morning commute, or when out running an errand, but the answer to this question may fascinate you.

Particularly the commercial real estate industry holds a lot of potential to impact economic development in a region. For entities who have made it a business to accrue large amounts of commercial real estate, they provide us with valuable insight into to the state of the economy, based upon their decision to buy or sell/lease space and at what price point. Knowing who the big players are can help keep us apprised of changes in the market that will ultimately trickle down to impact businesses far and wide.

So who are these businesses and how much property do they own? Among private, for-profit entities located in Central Pennsylvania, these are the top five “power landlords” who own the most office space in the region.

  1. Linlo Properties

According to a CoStar Group analysis on April 5, Linlo Properties owns 745,349 square feet of space in Central Pennsylvania. Linlo’s assets include the AT&T Building, an 87,718 square-foot building at 2550 Interstate Drive; 4250 Crums Mill Road, a 75,000 square-foot building; Vista Plaza, a 71,800 square-foot building at 1215 Manor Drive; and Hillside Corporate Center, a 68,525 square-foot building located at 5001 Louise Drive.

  1. Healthcare Trust, Inc.

Healthcare Trust, Inc., a non-traded traded real estate investment trust that focuses primarily on healthcare related assets, comes in second, per CoStar data, with all its 638,516 square feet purchased from UPMC Pinnacle (formerly Pinnacle Health) in 2014. The Landis Building, located at 2501 North Third Street (formerly part of Polyclinic Hospital) is its largest holding at 314,790 square feet.

  1. High Associates

High Associates is the third-biggest property owner in the region with 561,276 square feet of commercial real estate. All their properties are in Lancaster County except 5000 Ritter Road, Mechanicsburg. 1853 William Penn Way, their largest holding, which is 82,331 square feet of space, is occupied by the High Companies.

  1. Select Capital Commercial Properties

Fourth is Select Capital Commercial Properties with 544,599 square feet of commercial real estate. Select Capital’s holdings include 225 Grandview Avenue (the former HP/EDS building) with 214,150 square feet; 300 North Second Street (Commerce Towers) with 72,000 square feet; and 425 N. 21st Street (Plaza 21) with 62,304 square feet.

  1. Hoffer Properties

Hoffer Properties ranks fifth with 531,741 square feet of space. Hoffer’s assets include 100 Sterling Parkway (the former PHICO building), a 220,000 square-foot building and 300 Sterling Parkway, the 129,000 square foot building built in 2016 for Deloitte.

These power landlords of Central PA hold a significant amount of commercial real estate assets. How they choose to use and further develop this space has the potential to shape the economy, locally and beyond, by attracting new businesses which brings new jobs. With the backing of these large entities who are continually investing in and improving commercial real estate, every business in the region benefits from the ripple of this economic impact.

It’s important to note that this list is limited to private, for-profit entities located in Central PA. Hbg. Realty Inc. (Harristown Development Corp.), PA Economic Development Agency, The Commonwealth of Pennsylvania, and Highmark, Inc. all rank higher than the top five on this list.

[Online Resources] Real Estate, camp hill, carlisle, central pa, central pennsylvania, Commercial Real Estate, costar, harrisburg, healthcare trust, high associates, hoffer properties, lancaster, landlord, Leasing, linlo properties, local, mechanicsburg, Mike Kushner, office, office real estate, Office Space, Omni Realty Group, pennsylvania, real estate agent, real estate broker, select capital commercial properties, selling, tenant representative, trends, york

Growing Demand for “Live-Work-Play” Communities in Central PA

Posted on December 4, 2018 by Mike Kushner in Blog, Commercial Real Estate, Community, Guest Blogger, Local Market, Trends No Comments

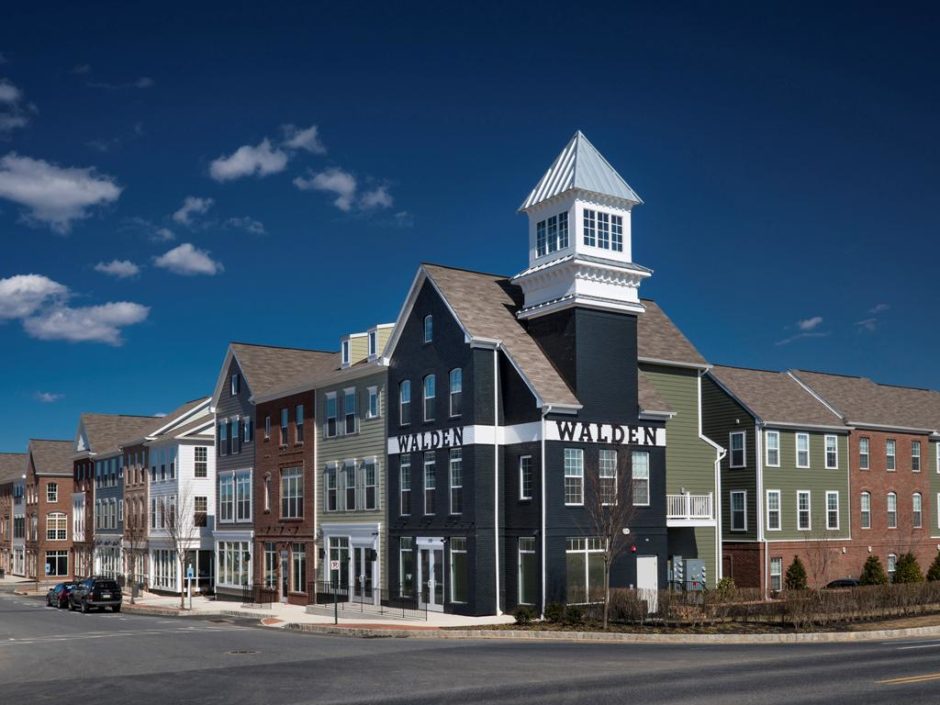
Photo: Walden in Mechanicsburg, PA

If you’ve been a resident of Central Pennsylvania for more than a few years, you’ve likely seen various live-work-play (LWP) communities – maybe you even live in one. What we’re talking about it mixed-use commercial and residential real estate where people have the opportunity to live, work and play (shop, dine, etc.) all in a relatively close distance to one another. A great example is the Walden community in Mechanicsburg, but there are many others that we will examine in this article.

To help us explore this growing trend, we turned to Chris LeBarton who is a Senior Market Analyst with CoStar Group. Chris covers commercial real estate data in Western Maryland, including the Baltimore metro area, up through Central Pennsylvania for CoStar’s Market Analytics platform.

Chris joins Mike Kushner of Omni Realty Group for a Q&A series where we specifically look at the growing demand for LWP communities in Central PA – and what this means for CRE professionals. Here is how Chris answers our most pressing questions.

Omni: When did the LWP trend begin and how has it grown?

Chris LeBarton: The earliest usage of LWP spaces I can find was in 2005. The trend really started to grow in popularity leading up to the market crash, but there’s no correlation between the two that I can see. The term “live-work-play” was very likely used prior to that, but I’m guessing the branding of mixed-use development really took off as concepts of ‘walkable urbanism’ and ‘Transit Oriented Development’ (TOD) exploded across the country.

According to the Urban Land Institute’s Mixed-Use Development Handbook, which was published in 2003, mixed-use development: provides three or more significant revenue-producing uses (such as retail/entertainment, office, residential, hotel, and/or civic/cultural/recreation); fosters integration, density, and compatibility of land uses, and; creates a walkable community with uninterrupted pedestrian connections.

Omni: Describe a LWP community in Central PA.

Chris LeBarton: First, let’s clarify what a LWP community really is, and what it is not. Some economic development entities and marketing types play pretty fast and loose with the term. An area can be a really nice place to live, work and play in, but if there’s over a mile or so between one element of the triad and the other two legs of the stool aren’t in the same building/development, it’s not really a LWP dynamic. Of course, the likelihood that most people who live in one of these communities also works in the same office/industrial park nearby is fairly low. But being able to do all three and be largely reliant on public transportation or your own two feet is really the spirit of the LWP concept.

Another key element to understand is that LWP is not at all relegated to a city environment. In fact, part of these projects’ collective appeal is that they can recreate a city environment without being in the hustle and bustle of a CBD. Specifically in Central Pennsylvania, there are a number of LWP developments. Here are just a few:

  • Lime Spring Square (Lancaster/Hempfield Township): A multi-phase, mixed-use campus being developed by Oaktree Development Group, the end result will include over 100,000 SF of retail, several hundred high-end apartments, and components of office, medical and industrial space. Penn State Health has a 76,000 SF medical office building there, while PDQ Industries is expanding operations into an 80,000 SF building.
  • North Cornwall Commons (Lebanon/North Cornwall Township): Another phased project that has been delayed off and on since being proposed in 2004, North Cornwall Commons is finally seeing movement at what would be the largest mixed-use development in Lebanon County history. A retail strip center with at least one confirmed tenant (a local coffee business) is underway at 148-acre site that includes plans for roughly 165 townhomes, office space and a hotel.
  • The 1500 Condominium (Harrisburg): An example of how you don’t have to have everything in one place, 1500 has 43 units (mostly rentals) that sit over top of two restaurants and is within walking distance to the Broad Street Market and several small-to-medium sized employers.
  • Wyomissing Square (Reading/Wyomissing Borough): A quintessential brownfield redevelopment, Wyomissing Square now consists of 250 4 Star apartments, a Courtyard by Marriott, small-scale retail, restaurants, and a 60,000 SF medical office building.

Omni: Who is the target demographic for this type of community?

Chris LeBarton: As with anything that deals with where people live, shop/eat or work, I think the answer is “All of the Above.” We hear all too often about Millennials, or Boomers, or Downsizers, or Divorcees. Honestly, the more conversations I have with leasing agents and brokers the more I’m convinced the rule is diversity and the exception is homogeneity. Granted, most of these LWP sites cater to the more upscale or educated among society, but that doesn’t mean there can’t be families with two working blue collar parents who make a decent living and who want to save money on a car/parking and live close to work.

Omni: What advice could help commercial real estate professionals capitalize on the LWP trend?

Chris LeBarton: I don’t give investment advice, but here are a couple thoughts. First, find a way to make it authentic. Be it the retail mix, or a unique concept to the green space, or simply having the “town center” not look boiler plate, be conscientious of that buzz word “place making.” If you’re going to basically spend the majority of your waking life in a small area, it can’t be boring or cookie cutter.

Next, think ahead. What will you need to provide 3-5 years from now? Who would have thought that cities would be crawling with scooters?! Or even just electric vehicles. People looking to walk or be publicly transported or drive as little/cheaply as possible will likely demand options and flexibility. Things to consider are multiple charging stations, bike share platforms, car-share parking lots, etc.

Finally, identify fairly gentrified but not-yet-there locations that are retail/grocery deserts. LWP in the middle of a depressed community won’t work in many places (there are exceptions, of course). But cool/changing areas that are the next ‘it place’ often still need the food and fun to complete the shift.

Omni: Looking to the future, how do you predict LWP communities to evolve in Central PA?

Chris LeBarton: I think you can expect to see more of these types of projects turn up around dying malls or outlet centers that have to repurpose big blocks of space. Another interesting new trend that I could see taking off is the rise of co-living and co-working spaces in the same building.

The LWP trend stands to have a significant impact on Central PA’s commercial real estate market. Because LWP communities rejuvenate the local community, drive business and create employment opportunities, Central PA should be encouraged that so many of these communities are popping up across the region. Additionally this type of real estate appeals to a wide variety of demographics, making it a valuable investment opportunity for commercial real estate professionals. Looking to the future, LWP communities could be among the most powerful tools to breathe new life into struggling areas, and spur a burst of new economic activity that is greatly needed.

What are your thoughts on the growing demand for live-work-place communities in Central Pennsylvania? Is this type of community attractive to you? Why or why not?

[Online Resources] Real Estate, analyst, buyers agent, camp hill, carlisle, central pennsylvania, chris lebarton, Commercial Real Estate, costar, CRE, harrisburg, hershey, lancaster, live work play, local, LWP, mechanicsburg, Mike Kushner, mixed use, office, Omni Realty Group, pennsylvania, real estate agent, real estate broker, real estate investor, residential, retail, tenant representative, trends, york

Central PA Office Submarkets End Quarter with Very Different Outcomes

Posted on November 8, 2018 by Mike Kushner in Blog, Local Market, Trends No Comments

Lancaster closes Q3 with the strongest market while Harrisburg West shows signs of distress.

The submarkets that make up Central Pennsylvania’s office real estate market each have unique advantages and disadvantages that really show through when you examine each individually. With the close of the third-quarter, we took a closer look at how the four main submarkets performed individually and comparatively.

The outcomes should surprise you! You may think you know which of the four submarkets outperformed the others, which one is most likely in distress and the others that are sitting pretty stagnant right now. But you’ll likely be shocked by the large variances in numbers, especially when compared to the historical averages and forecasted averages of what is yet to come.

Let’s take a closer look at some of the most interesting trends and numbers reported from CoStar’s Q3 2018 office report for Harrisburg East, Harrisburg West, Lancaster and York.

Harrisburg East

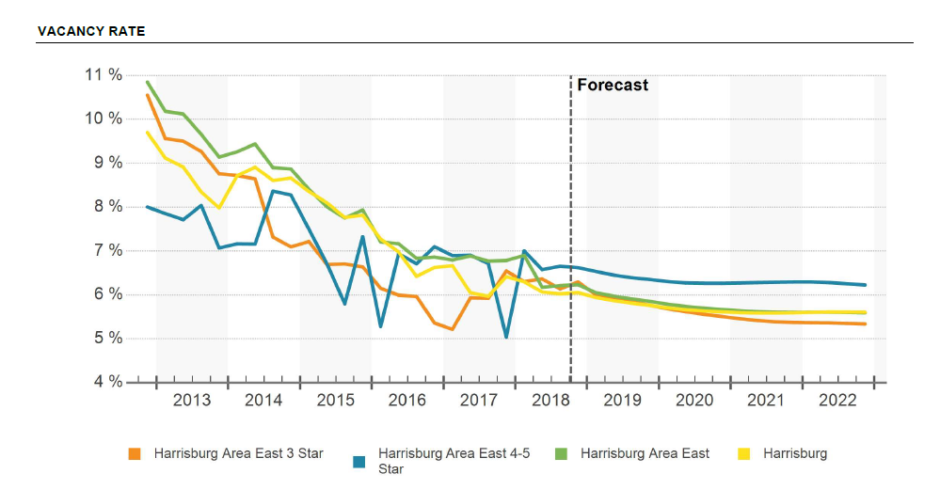
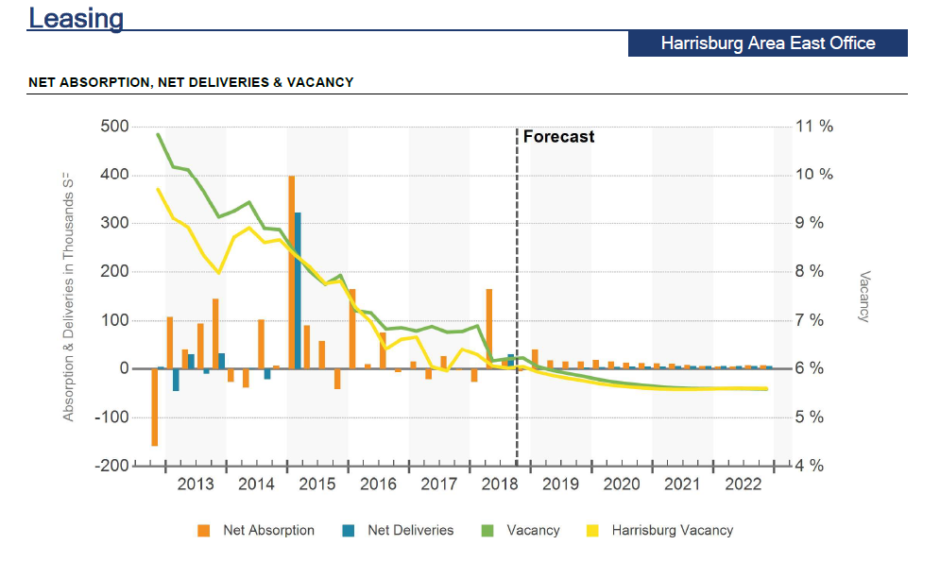
Vacancy – The vacancy rate for Q3 2018 in the Harrisburg East submarket is 6.4%. This is notably lower than the historical average of 7.8% and the forecast average shows this dipping lower to 5.7%. For comparison, the peak in vacancy rate occurred in Q4 2012 when it reached 10.8% and the trough was in Q4 1997 when it plummeted to 3.1%.

12 Month Net Absorption in SF – The twelve-month net absorption is 106,000 square-feet. While this is still lower than the historical average of 187,046 square-feet, the forecast average predicts the current net absorption will fall significantly to 61,648 square-feet. Though not by much, net absorption will at least remain in the black for now.

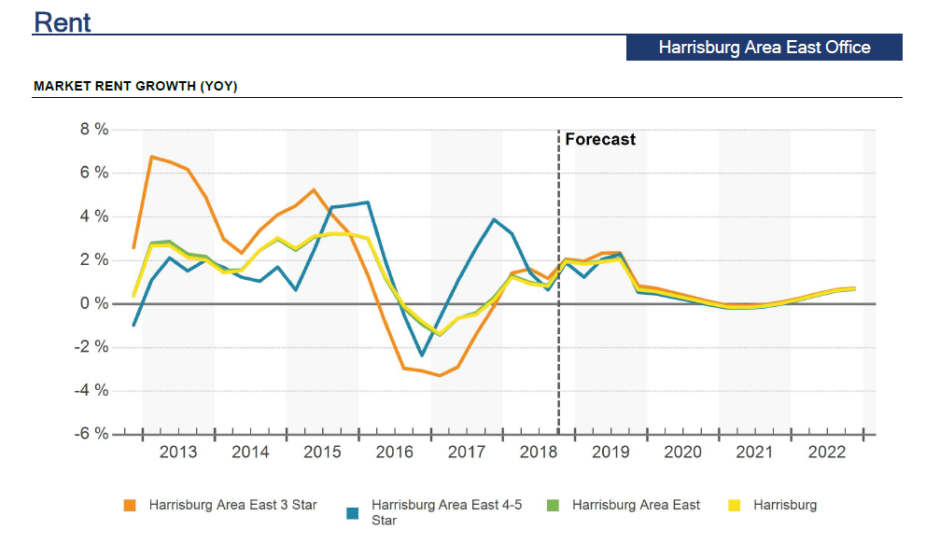
Rent Growth – The current 12 month rent growth is 2.0%. This is higher than the historical average of 1.4%, though the forecast average predicts that this will fall to 0.7%. For comparison, the peak in Harrisburg East’s rent growth occurred in Q1 2001 when it reached 8.3% and the trough was in Q4 2009 when it plummeted to -2.4%.

12 month deliveries in SF – Harrisburg East has a twelve-month delivery of 30,000 square-feet. This takes into account all of the deliveries that occurred over the last year; however no new buildings were delivered specifically in Q3 2018. Additionally, 20,000 square-feet of 4 and 5 star office space is under construction, which will be delivered in coming quarters.

Harrisburg West

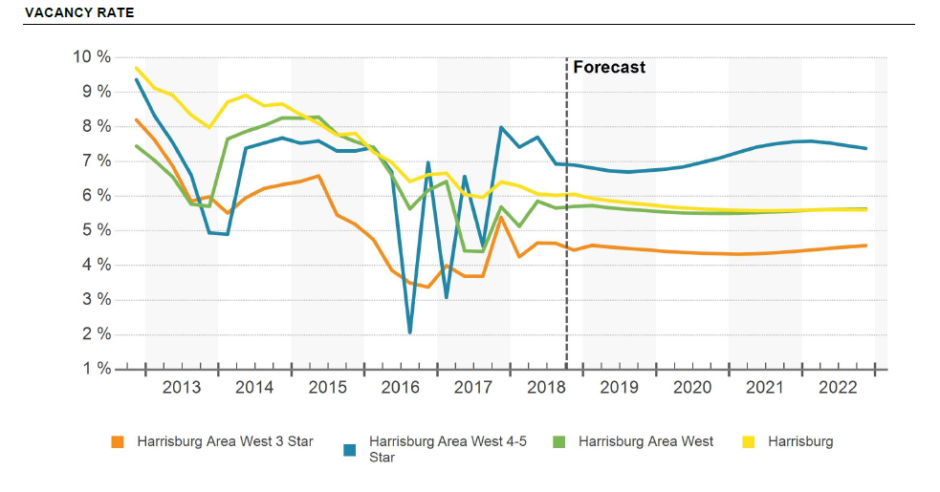
Vacancy – The vacancy rate for Q3 2018 in the Harrisburg West submarket is 7.3%. This is slightly higher than the historical average of 7.0%; however, CoStar’s forecast average predicts this to dip to 5.6%. For comparison, the peak in vacancy rate occurred in Q2 2002 when it reached 9.8% and the trough was in Q4 1997 when it plummeted to 2.5%.

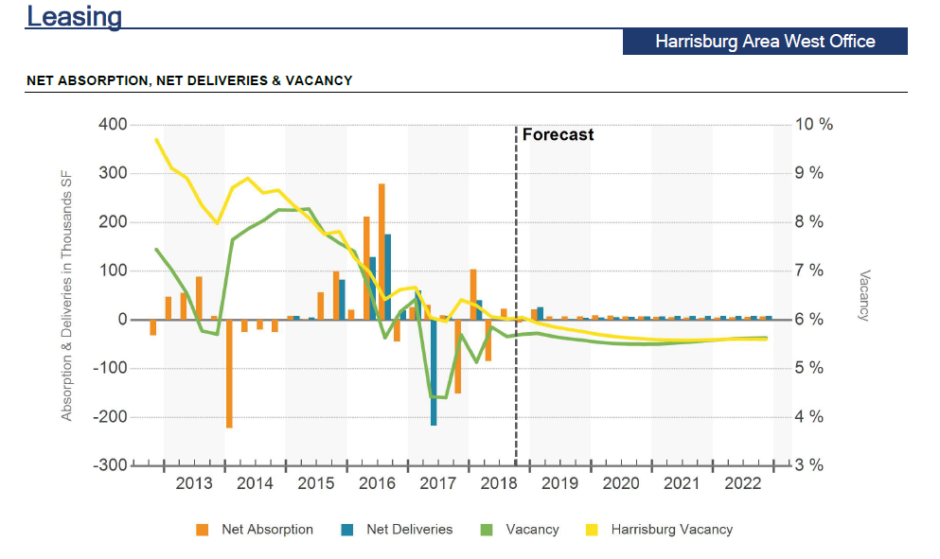
12 Month Net Absorption in SF – The twelve-month net absorption is negative 258,000 square-feet. The historical average is 95,454 square-feet and the forecast average predicts the market will again return to positive numbers with 25,193 square-feet. Q3 net absorption is not far from where it was in Q4 2014 when it was negative w 292,042 square-feet. Since then, it peaked in Q3 2016 at 611,057 square-feet before falling substantially to its current negative state.

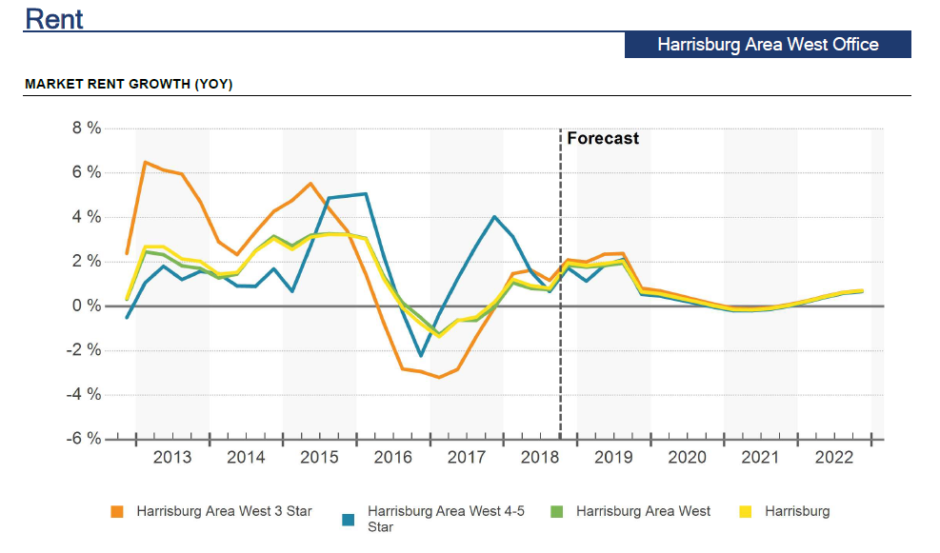
Rent Growth – The current 12 month rent growth is 1.9%. This is higher than the historical average of 1.4%, though the forecast average predicts that this will fall to 0.6%. For comparison, the peak in Harrisburg West’s rent growth occurred in Q3 2000 when it reached 7.1% and the trough was in Q4 2009 when it plummeted to -2.8%.

12 month deliveries in SF – Harrisburg West has a twelve-month delivery of 40,000 square-feet, compared to the historical average of 127,660 square-feet. This takes into account all of the deliveries that occurred over the last year; however no new buildings were delivered specifically in Q3 2018. Additionally, 26,400 square-feet of 3 star office space is under construction, which will be delivered in coming quarters.

Lancaster

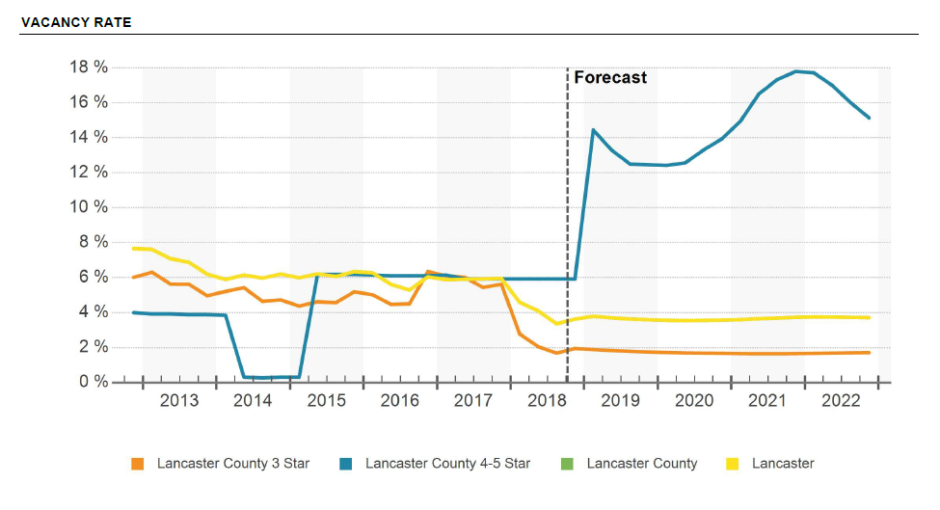
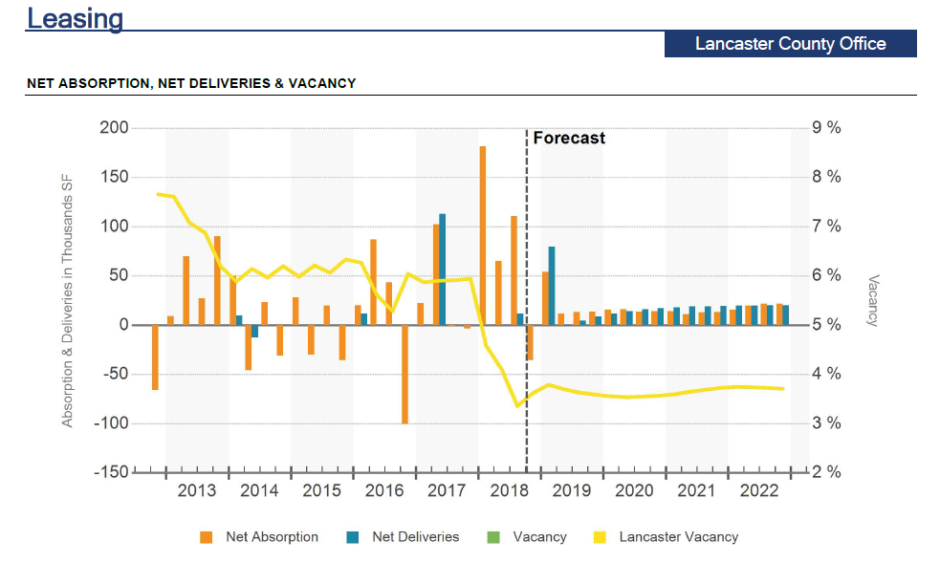
Vacancy – The vacancy rate for Q3 2018 in the Lancaster submarket is 3.6%. This is notably lower than the historical average of 6.8%; the forecast average predicts this remain fairly stable at 3.7%. For comparison, the peak in vacancy rate occurred in Q4 2004 when it reached 9.7%. The lowest the vacancy rate has ever been in Lancaster County is actually right now, in Q3 2018.

12 Month Net Absorption in SF – The twelve-month net absorption is 324,000 square-feet. The historical average is substantially lower than what it is currently and that is 109,103 square-feet. The forecast average predicts net absorption will decrease to 89,086 square-feet.

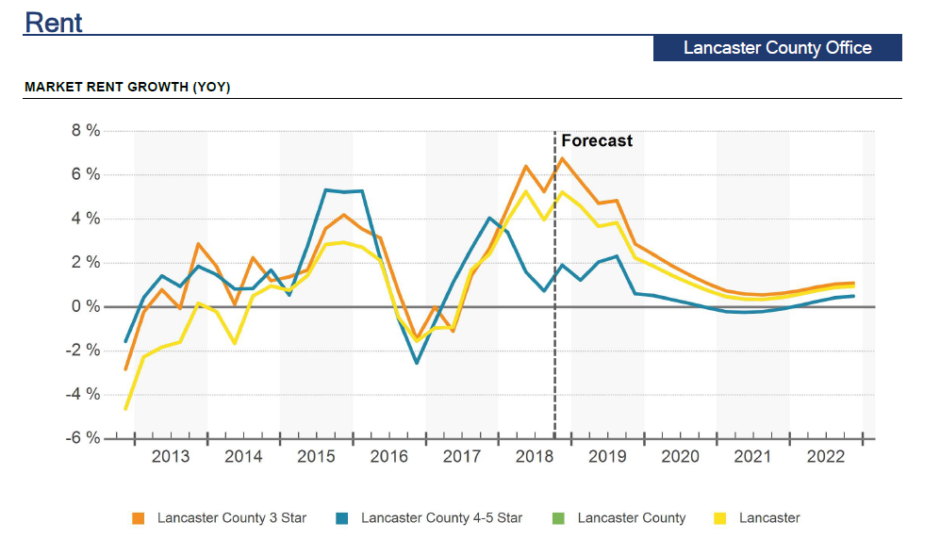
Rent Growth – The current 12 month rent growth is 4.9%. This is significantly higher than the historical average of 1.3%, though the forecast average predicts that this will fall to 1.6%. For comparison, the peak in Lancaster’s rent growth occurred in Q3 2000 when it reached 6.9% and the trough was in Q4 2009 when it plummeted to -5.0%.

12 month deliveries in SF – Lancaster has a twelve-month delivery of 12,000 square-feet, compared to the historical average of 114,237 square-feet. This takes into account all of the deliveries that occurred over the last year; however no new buildings were delivered specifically in Q3 2018. Additionally, 81,840 square-feet of 4 and 5 star office space is under construction, which will be delivered in coming quarters.

York

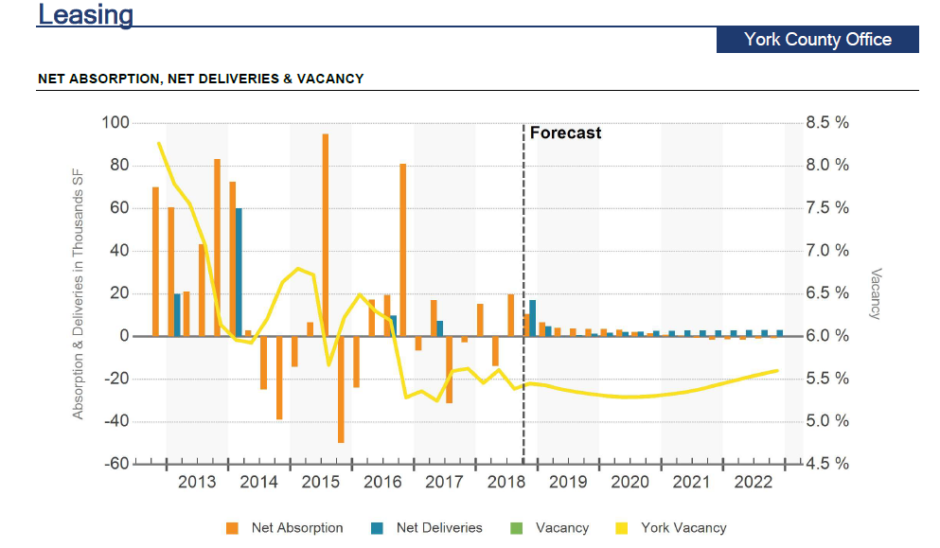
Vacancy – The vacancy rate for Q3 2018 in the York submarket is 5.3%. This is lower than the historical average of 6.9%; the forecast average predicts this remain fairly stable at 5.4%. For comparison, the peak in vacancy rate occurred in Q1 2008 when it reached 10.5%. The lowest the vacancy rate has ever been was 2.2% in Q4 1998.

12 Month Net Absorption in SF – The twelve-month net absorption is 29,500 square-feet. The historical average is 72,892 square-feet. The forecast average predicts net absorption will decrease to 8,847 square-feet.

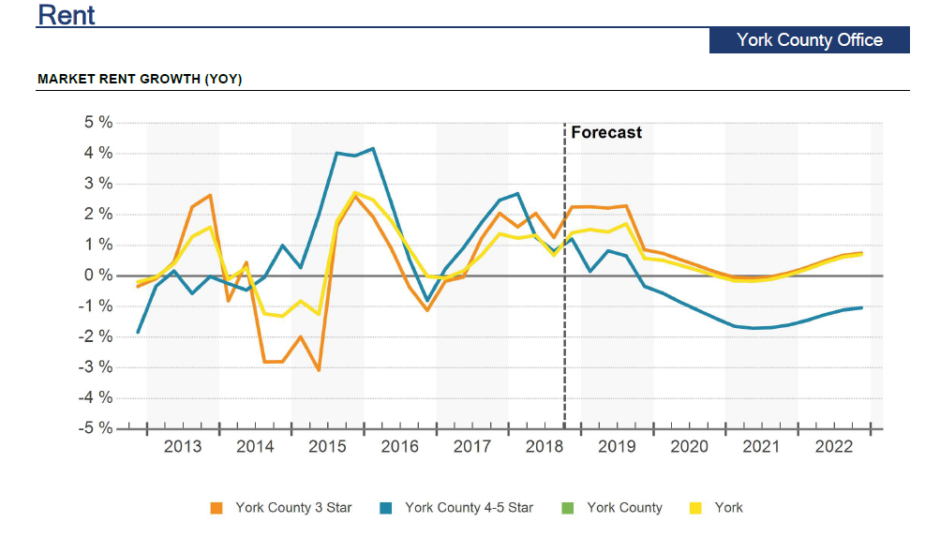
Rent Growth – The current 12 month rent growth is 1.6%. This is fairly close in line with the historical average of 1.1%, though the forecast average predicts that this will fall to 0.6%. For comparison, the peak in York’s rent growth occurred in Q3 2000 when it reached 6.8% and the trough was in Q3 2009 when it plummeted to -4.3%.

12 month deliveries in SF – York has a twelve-month delivery of 0 square-feet, compared to the historical average of 80,056 square-feet. The forecast average predicts that this rise to 13,093 square-feet. Additionally, 22,000 square-feet of office space is under construction, 17,000 square-feet of 4 and 5 star space and 5,000 square-feet of 3 star space, which will be delivered in coming quarters.

Key Takeaways

Overall, York County and Harrisburg East have been very stable. Not much is moving the needle. There is not a lot of absorption nor much new construction that could spur activity.

The real positive news from Q3 2018 is Lancaster County. This submarket rose above the rest for several reasons. First is its 324,000 square-feet in net absorption and 4.9% rent growth (highest since Q3 2003). Additionally the vacancy rate decreased 2.3%. Currently there are 81,840 square-feet under construction and 89,166 square-feet of new construction proposed.

In contrast, the Harrisburg West submarket is showing signs of distress. Its negative 282,000 square-feet of net absorption combined with a modest vacancy rate increase of 1.6% does not offer much hope for a major turnaround anytime soon. Additionally, the submarket has 86,400 square-feet of new office space under construction and 225,596 square-feet of proposed new space that the market will struggle to absorb, further driving down the net absorption.

Based on the activity taking place in Central Pennsylvania’s office real estate submarkets, how do you think this will impact business growth and development throughout these counties? How will this have a ripple effect into other areas of our economy?

Share your ideas by leaving a comment below!

[Online Resources] Real Estate, analysis, central pa, Class A, Class B, Class C, Commercial Real Estate, commercial real estate agent, commercial real estate broker, costar, east, harrisburg, lancaster, local, market, Mike Kushner, office, office real estate, Office Space, Omni Realty Group, pennsylvania, real estate agent, real estate broker, realty, report, stats, tenant representative, trends, west, york

High Rental Rates, Low Vacancy Define Central Pennsylvania Industrial Market

Posted on August 27, 2018 by Mike Kushner in Blog, Industrial, Local Market, Trends No Comments

Central PA’s submarket clusters for industrial real estate have some of the lowest vacancy rates and highest rental rates we have seen in recent years.

It’s the news that every commercial real estate developer and investor want to hear – the industrial real estate market in Central Pennsylvania ended Q2 2018 with some of the highest rental rates and lowest vacancy rates the market has experienced since 2014.

Now, it hasn’t been a steady climb over the last four years. Rather there’s been quite a bit of volatility in the market, with numbers bouncing up and down and up and down. However, it does appear that the extreme peaks and valleys have evened out and a more stable, yet steadily growing industrial real market has emerged in Central PA – at least for the present moment.

Let’s take a closer look at some of the most interesting trends and numbers reported from CoStar’s Q1 2018 report for Harrisburg/Carlisle, Lancaster and York/Hanover Submarket Clusters.

Harrisburg/Carlisle Submarket Cluster

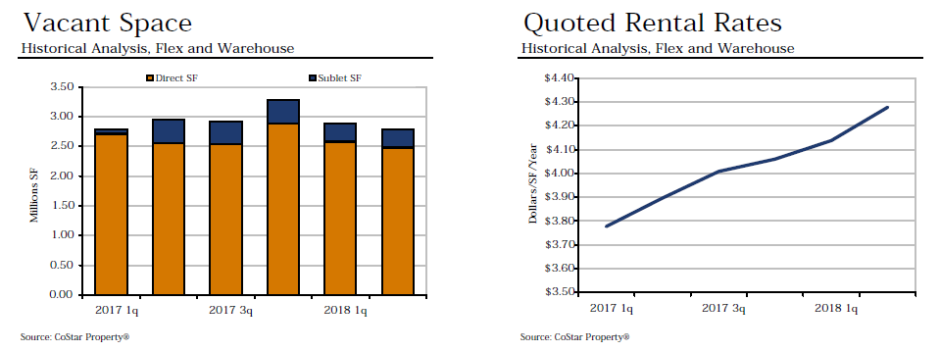
Vacancy – The industrial vacancy rate for the Harrisburg/Carlisle Submarket Cluster fell significantly from Q1 2018 where it was previously 9.4% to its now 7.9%. This is the largest drop between a single quarter that the market has seen since prior to Q3 2014. In fact, starting with Q2 2017, the industrial vacancy rate for the Harrisburg/Carlisle Submarket Cluster has been quite volatile, swinging up and down by sometimes more than one percentage point in a quarter.

Absorption – The pattern of volatility in the Harrisburg/Carlisle Submarket Cluster continues with its net absorption. Though the market ended 2017 at a positive 2,692,866 square-feet, in Q1 2018 this dropped to a negative (2,132,086) square-feet, mostly due to a single building of 1,100,000 square-feet that was delivered that same quarter. Now in Q2 2018, net absorption is back in the positive at 1,385,445 square-feet with no new buildings delivered this quarter.

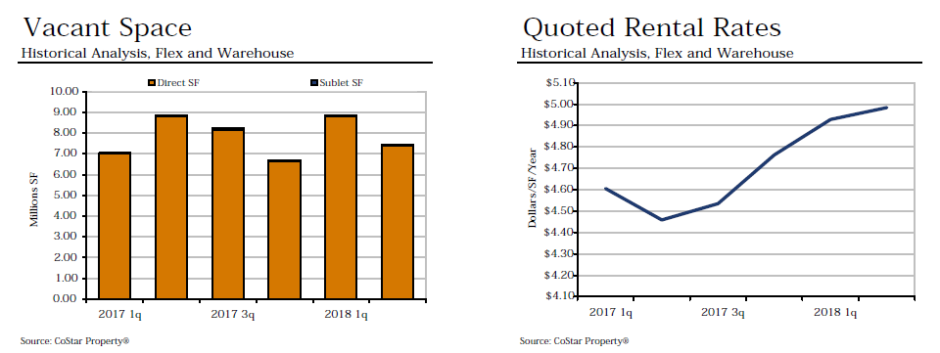
Rental Rates – The average quoted asking rental rate for available industrial space is $4.98. This has been steadily increasing ever since it experienced a drop in Q2 2017 where it dropped from $4.61 to $4.46 in one quarter. Now at almost $5.00 per square foot of space, the Harrisburg/Carlisle Submarket Cluster’s rental rates for industrial space is the highest it has been since prior to Q3 2014.

Inventory – As mentioned above, no new buildings were delivered this quarter, or in all of 2018. Three buildings are currently under construction, totaling 2,951,468 square-feet of new space. It’s estimated that these properties will not be delivered until early 2019.

Lancaster Submarket Cluster

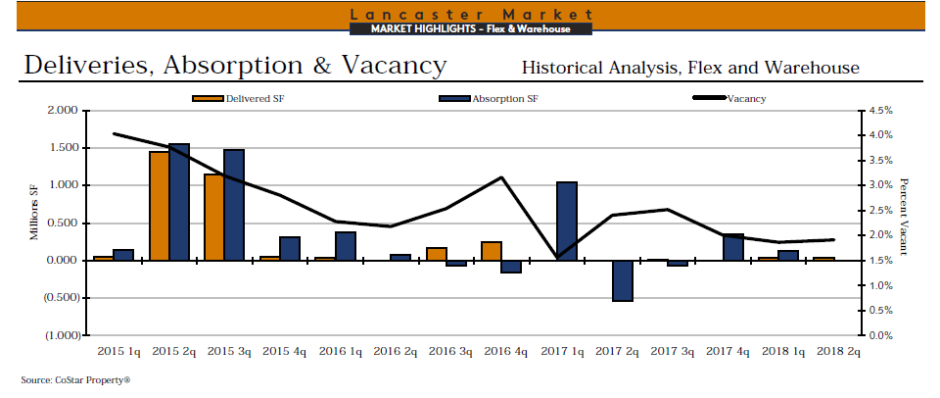
Vacancy – The vacancy rate for the Lancaster Submarket Cluster in Q2 2018 held steady at 1.9%, the same as it was in Q1 2018. In fact, it has changed minimally from the 2.0% that Q4 2017 ended with. Previous to these last three quarters, there has been a lot more change from quarter to quarter in the Lancaster Submarket Cluster’s vacancy rate. To be this low, and this consistent for three quarters indicates a stable market with supply and demand near evenly matched.

Absorption – As for net absorption, Q2 2018 ended with a positive 2,723 square-feet. This is a drop of 127,888 square feet from Q1’s net absorption of 130,611 square-feet. After experiencing two quarters of negative net absorption in Q2 and Q3 2017, and rebounding to positive 354,056 square-feet in Q4, this is now the third quarter that net absorption has continued to drop, though still a positive number – for now.

Rental Rates – The quoted asking rental rate for available industrial space in the Lancaster Submarket Cluster took a hit this quarter when it dropped from $4.74 to $4.57 per square foot. The trend in rental rates have been up and down and up and down over the course of the last four years. While it peaked at $5.15 per square foot in Q4 2016, it has never been able to return to that high and is now trending downward, inching closer to the numbers we saw in early 2015.

Inventory – One new building was delivered this quarter, adding 35,768 square-feet of new space to the industrial market. There are no other buildings currently under construction in the Lancaster Submarket Cluster.

York/Hanover Submarket Cluster

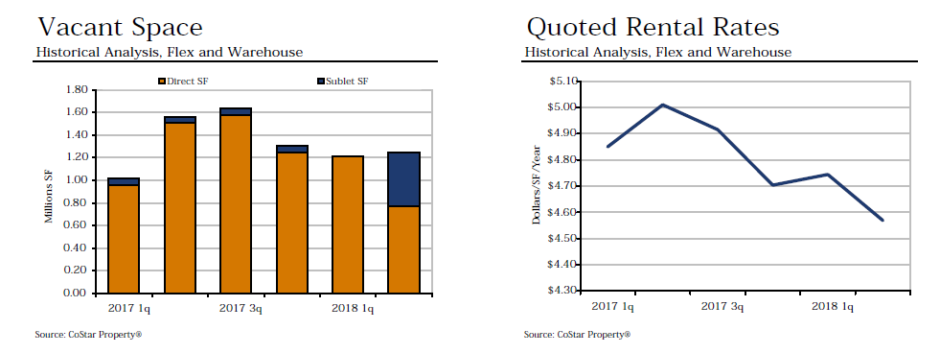
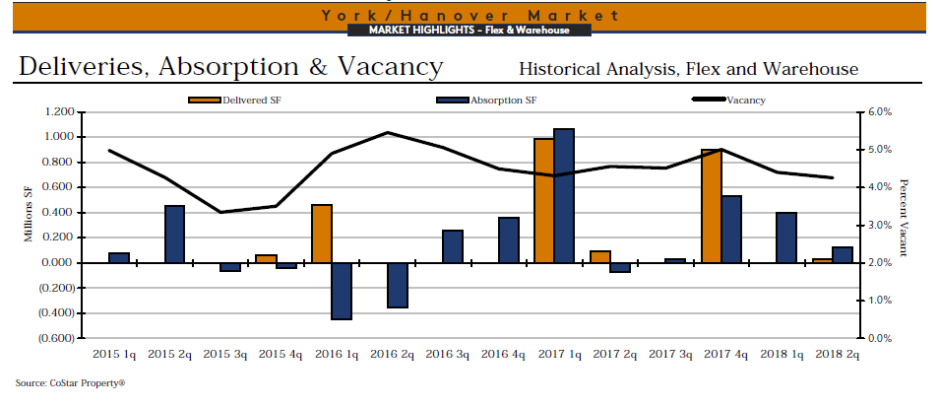
Vacancy – The industrial vacancy rate for the York/Hanover Submarket Cluster dipped ever so slightly this quarter from 4.4% in Q1 2018 to its current 4.3%. This is the lowest vacancy has been in over a year when it was also 4.3% in Q1 2017. From that point, the vacancy rate was on the rise, peaking at 5.0% in Q4 2017, then dropping 0.6% points to 4.4% in Q1 2018.

Absorption – Q2 2018 ended with a net absorption of 125,766 square-feet.  Looking at Q1’s net absorption of 396,112 square-feet, this is a drop of 270,345 square-feet in a single quarter. Between these two quarters only one new building of 30,000 square feet was delivered to the market.

Rental Rates – The Lancaster Submarket Cluster ended Q2 2018 with a quoted asking rental rate of $4.28. This is $0.14 higher than it was in Q1 and $0.22 higher than in Q4 2017. In fact, this is the highest rental rate this submarket cluster has seen since prior to Q3 2014 with it near steadily rising during that entire period.

Inventory – Only one new building was delivered in Q2 2018 and that added 30,000 square-feet of industrial space to the market. There are currently no new buildings under construction at this time.  

Key Takeaways

Given all the activity taking place in the various Central PA submarket clusters, there are particular insights that are important to note. First, we can expect vacancies to remain at record lows for the remainder of 2018, despite a further uptick in new construction. Additionally, E-commerce sales grew 15.2% in Q2 2018, compared with the same time last year and now represent 9% of total sales. E-commerce will continue to be a driving force in the foreseeable future.

While indicators point to strong demand, there are headwinds increasing from labor shortages and tariffs. With the economy at or near full employment, site selection decisions and supply chain nodes may be driven out to secondary and tertiary markets. Finally, it is too early to predict the exact impact of tariffs on the industrial market, but we can look for potential declines in import and export levels.

Looking at the comparison of the three Central Pennsylvania submarket clusters, which do you feel has the strongest industrial real estate market right now? What changes do you anticipate taking place throughout the rest of 2018?

Share your ideas by leaving a comment below!

[Online Resources] Real Estate, absorption, central pa, Commercial Real Estate, costar, data, developer, industrial, inventory, investor, manufacturing, market, Mike Kushner, Omni Realty Group, pennsylvania, rental rates, report, space, statistic, trends, warehouse

Major Trends Impacting Central PA’s Retail Real Estate Market in 2018

Posted on May 24, 2018 by Mike Kushner in Blog, Local Market, Trends No Comments

For Central Pennsylvania’s retail real estate market, things are off to a, well, interesting start. The market has seen its fair share of ups and downs in recent quarters, and 2018 is no exception. On one hand, major retailers continue to shutter brick and mortar locations across the Susquehanna Valley. At the same time, other retailers are making the move into new locations. It can be hard to grasp what’s really going on in the market. Does the good outweigh the bad? What will the next quarter bring? The next year? For the answers, we turn to an expert.

Senior Market Analyst with CoStar Group, Chris LeBarton covers commercial real estate data in markets stretching from Western Maryland, including the Baltimore metro area, up through Central Pennsylvania for CoStar’s Market Analytics platform. His insight and expertise are helpful for understanding not only where the market currently stands, but how it’s likely to move in the future.

Chris joins Mike Kushner of Omni Realty Group for a Q&A series where we specifically look at the current state of Central Pennsylvania’s retail real estate market – as well as trends and challenges that stand to reshape things in 2018 and beyond. Here’s how Chris answers our most pressing questions.

Omni: With a net absorption of almost 95,000 SF, the Harrisburg East Retail submarket had a great bounce back quarter in Q1 2018 after four consecutive featuring net move outs. Can you elaborate on the various factors contributing to this?

Chris LeBarton: Retail leasing on the east side of Harrisburg has been fairly whippy this cycle, and certainly since 2015. So, putting too much stock into it is unwise. Minus Hobby Lobby’s move into almost 70,000 SF at Colonial Commons, this looks like less of a win. With that said, there are some strong pockets of buying power (median household income x households) in this submarket, including parts surrounding Colonial Park. In fact, Dauphin County has been one of the faster-growing counties in Pennsylvania since 2010.

Omni: What were the largest lease deals that took place in Central PA’s (Harrisburg East and Harrisburg West) retail real estate market in Q1 2018?

Chris LeBarton: Hobby Lobby’s move-in was the standout for sure, but there were a couple other sizable deals in the region. There was 15,000 SF leased in Carlisle on Newville Road and Ideal Auto Body absorbed 11,000 SF in Hanover. Also, Generations of Furniture signed a three-year deal on roughly 8,100 SF in Lancaster.

Omni: Amidst recent, massive retail closings, how would you say Central PA has responded/rebounded? What factors contribute to your assessment?

Chris LeBarton: Few areas are immune to the wave of big-box retail closings; stores like Kmart, Sears, Boscov’s, Macy’s and Toys R Us were once ubiquitous across the country. But a review of the biggest names shows fairly limited exposure in Central PA. Simply based on population density, natural tourism corridors, and buying power, this region isn’t swimming in malls and power centers. A review of a dozen or so metro areas inside Central Pennsylvania shows that, overall, vacancies are largely where they were coming out of the crash and in some cases improved.

In addition, several retailers that did not have a presence in Central Pennsylvania have absorbed space vacated by some of the big box closings. Stein Mart, Home Goods, and Hobby Lobby moved into the former Kmart on the Carlisle Pike. In Lower Paxton Township, Hobby Lobby opened in the former Giant Foods location and Giant moved across the road to the space vacated by Gander Mountain. At the Capital City Mall, Field and Stream moved into the former Toys R Us location. Overall, Central PA should feel encouraged that the region was no by means hit the hardest, compared to others. In fact, some significant regrowth has occurred as a result of many of these retail closings.

Omni: In your opinion, what are some of the future trends you expect to see in the Central PA retail real estate market?

Chris LeBarton: Mixed-use projects offering at least live-play (work there, or nearby, is an added bonus) with smart ground floor retail are all the rage. If areas outside of the major urban centers want to grow their population, they need to think about approving these types of projects. Naturally occurring affordable housing is becoming a big draw for those who want a nice place to live, but don’t want the high price tag. Developers who are trying to overcome the challenges of rising land and labor costs are looking more and more at secondary and tertiary markets, and there’s no reason Harrisburg can’t accommodate small-to-midsized projects with local/authentic retailers.

Another trend on the rise is related to the last piece of the “last mile” industrial craze and e-commerce. Central Pennsylvania is booming with warehouse and distribution construction; as a result, the biggest population centers in the region may see retailers testing new concepts here. Amazon Key, a home delivery service, opened in close to 40 cities last fall, and Walmart is doing all it can to keep up with the biggest player in the space. It would be reasonable to think that such trends could make their way to the Central PA retail real estate market as well.

While technology and the shift in the way consumers prefer to shop and purchase goods has had a significant impact retail real estate, we can expect the market to react and adapt – just like any industry must to stay afloat. The key to survival is for retailers to stay in front of emerging trends, keep an eye on competitors, and be willing to evolve.

How do you feel Central PA is responding to the changes and challenges taking place in the local retail real estate market? Are you more hopeful or more concerned? Share your thoughts by leaving a comment below!

[Online Resources] Real Estate, 2018, central pa, central pennsylvania, challenges, changes, chris lebarton, Commercial Real Estate, costar, east, gettysburg, harrisburg, lancaster, market report, Mike Kushner, Omni Realty, pennsylvania, retail, retailers, trends, west, york

10 Facts Any Commercial Real Estate Investor Should Know about Central PA’s Industrial Market

Posted on April 30, 2018 by Mike Kushner in Blog, Commercial Real Estate, Industrial, Local Market No Comments

10 Facts Any Commercial Real Estate Investor Should Know about Central PA’s Industrial Market

Central PA’s industrial real estate market is unique for a variety of different reasons. Taking into consideration its geographic, demographic and economic factors, we’ve compiled a list of what we feel are the most important facts worth knowing about our local industrial market.

If you are a commercial real estate investor, or simply someone who wants to know more about Central Pennsylvania’s commercial real estate market, you are sure to find this list of top 10 facts both valuable and interesting. Let’s take a look!

  1. Harrisburg-York-Lebanon CSA is 3rd most populous in PA and 43rd most populous in U.S.

The Harrisburg-York-Lebanon Combined Statistical Area (CSA) is made up of six counties and includes four metropolitan areas in Central Pennsylvania. In 2010, the CSA’s population was 1,233,708 people, making it the 3rd most populous CSA in PA and the 43rd most populous CSA in the U.S. The Harrisburg-York-Lebanon CSA includes the following Metropolitan Statistical Areas (MSAs): Harrisburg-Carlisle, Lebanon, Gettysburg and York-Hanover.

  1. Harrisburg area puts up strong competition against Lehigh Valley.

Though Lehigh Valley is commonly recognized as Pennsylvania’s leader in warehousing and distribution, Harrisburg delivered only 600,000 SF less than Allentown in 2017, while also generating roughly the same rent growth. Additionally, companies such as Whirlpool, Amazon, Ace Hardware, FedEx, Kohler, and Lindt Chocolates have set up large-scale warehouse and distribution centers in Harrisburg – and those tenants account for just a portion of more than 16 million SF of net absorption.

  1. Harrisburg-Carlisle and Lancaster Ranked Among Leaders in National Job Growth

Of the 25 metro areas with the fastest job growth, as of August 2017, both Harrisburg-Carlisle and Lancaster placed on this competitive list. Lancaster ranked number 24 for its steady growth as it diversifies its economy and renovates its downtown and industrial areas. In six months Lancaster added 3,100 new jobs, bringing its total employment to 252,400 and 2017 growth rate to 1.23%. Harrisburg-Carlisle ranked number 8 on the list with 6,200 new jobs added in the first two quarters of 2017, bringing total employment to 346,100 and 2017 growth rate to 1.82%. Noted was the area’s diverse group of healthcare, technology and biotechnology businesses.

  1. Prime location for warehousing and distribution.

Central Pennsylvania is a premiere market for industrial space for several compelling reasons. For businesses who need easy and affordability storing and shipping of products, the areas offers a great roadway system, an abundant work force, relatively inexpensive and available raw land, and the ability to reach 70 to 80 percent of the U.S. population in 24 hours. Additionally, our government regulations on warehousing and distribution are comparatively easy and straightforward compared to other nearby states or regions.

  1. Four of the 10 Select Top Industrial Leases in Q4 2017 took place in the Harrisburg market.

According to CoStar’s Q4 report for 2017, Harrisburg east and west markets represented the majority of top industrial leases signed that year. Prologis Carlisle (1,029,600 SF), Goodman Logistics Center Carlisle (1,007,868 SF), Prologis Harrisburg (623,143 SF) and Carlisle Distribution Center (575,000 SF) were all leased to different businesses who were looking to grow their industrial real estate space in Central Pennsylvania. This activity indicates economic growth and interest in Central PA’s industrial real estate market, both from businesses and real estate investors.

  1. Lancaster market has the highest quoted rental rate for industrial space in Central PA at $4.69 per SF.

Even though Lancaster’s quoted rental rate for industrial space decreased by $0.45 per SF than where it was at the end of Q4 2016, it still comes in higher than Central PA’s other surrounding submarkets. At $4.69 per SF, Lancaster is $1.41 per SF higher than Lebanon, $0.03 per SF higher than Harrisburg/Carlisle, $0.08 per SF higher than Gettysburg and $0.67 per SF higher than York/Hanover based on Q4 2017.

  1. Lancaster also has the lowest vacancy rate for industrial space in Central PA at just 2.0%.

Lancaster ended Q4 2017 with the lowest vacancy rate of all surrounding submarkets. Compared to Lancaster’s vacancy rate of 2.0%, Lebanon came in at 15.8%, Harrisburg/Carlisle at 6.8% and York/Hanover at 4.9% based on Q4 2017. Though Gettysburg did end 2017 with a vacancy rate of 0.4%, it’s important to note this submarket has just 78 buildings with a combined 4,372,179 SF of existing inventory which places it at a much different level than the other submarkets, comparatively.

  1. Within the MSA, Harrisburg/Carlisle has the largest SF of industrial space under construction at 1,813,468 SF.

Two significantly large industrial projects will soon result in the addition of 1,813,468 SF to the Harrisburg/Carlisle submarket. Comparatively, Lebanon has three buildings under construction with a combined 1,310,195 SF of space, Lancaster has two buildings under construction with a combined 76,486 SF of space, York/Hanover has two buildings under construction with a combined 895,000 SF of space and Gettysburg has no new industrial space under construction. For Central PA as a whole, that equals 4,095,149 SF of new industrial space that will soon be delivered to the market.

  1. Harrisburg/Carlisle’s ended 2017 with a positive net absorption of 2,700,108 SF.

According to CoStar’s Q4 2017 industrial market report, Harrisburg/Carlisle ended the year with the highest, positive net absorption we’ve seen since prior to 2014. At 2,700,180 SF, this is significantly higher than any other quarter that year, especially Q2 where the net absorption dropped to negative 499,576 SF. Additionally is Q4 2017, one new building was delivered to the market, adding 1,100,000 SF of space. Even with this influx of inventory, the net absorption rose by 2,083,756 SF. The new building that was delivered is Whirlpool’s new distribution facility located at 100 Fry Drive, Mechanicsburg.

  1. Influx of State and Federal dollars will continue to improve transportation in and around Central PA.

The Trump administration has recently been touting a $1.5 trillion, 10-year public-private plan to improve roads, bridges, ports and other infrastructures across the nation. Central Pennsylvania has plans to utilize some of this federal funding to bolster its priority projects which include fixing structurally deficient bridges and widening interstates. Improvement to our roadways and infrastructure will improve public safety, create construction jobs and make Central PA an even more attractive location for warehousing and distribution.

After reading through these top 10 facts any commercial real estate investor should know about Central PA’s industrial market, you are likely to have some comments or questions of your own.

Start a discussion by leaving a comment below!


[Online Resources] Real Estate, camp hill, carlisle, central pa, central pennsylvania, commercial, Commercial Real Estate, costar, CRE, data, distribution, harrisburg, hershey, hummelstown, industrial, information, investment, investor, lemoyne, list, mechanicsburg, Mike Kushner, msa, Omni Realty, pennsylvania, research, statistics, top 10, trends, trucking, warehouse

Current State of the U.S. Economy and Its Impact on Commercial Real Estate – Part II

Posted on December 12, 2017 by Mike Kushner in Blog, Commercial Real Estate, CPBJ Articles, Trends No Comments

Note: This article was published by the Central Penn Business Journal. Click here to read the original version.


Continuing with part II from our series on the health and future of the U.S. economy, we again welcome the knowledge and insight of Robert Calhoun. Robert is the Northeast Regional Economist for CoStar Group where he manages a team of economists and analysts tasked with producing research at a local, regional and national level on commercial real estate, the economy and capital markets.

Let’s now dive into what real estate market participants should be keeping a watchful eye on in 2018 – Be sure to also take a look back at part I from this series which focuses on the U.S. economy as a whole!

Omni: Debt drives real estate markets and there’s a flood of capital in the market right now. Is this a shoe waiting to drop?

I say that all the time: debt drives real estate markets. What you worry about from a capital markets standpoint is that a flood of capital leads to declining underwriting standards, and so far we aren’t seeing anything overly alarming on that front.

There has been some gradual loosening of underwriting standards in the CMBS space, but this has generally been met with demands of higher credit support by the rating agencies. Investors are still doing a good job of differentiating collateral and demanding higher yields for riskier deals. We are seeing a resurgence of CRE CLOs during this cycle, but the structure of these deals are much better than the previous cycle (simpler and easier to understand, more capital in the deals, etc.).

Omni: What is contributing to the widening gap between bid and ask prices in the commercial real estate market right now?

We’ve been watching the staring contest between buyers with dry powder and owners with big gains for some time. While many owners would probably like to take advantage of current valuations and harvest gains at low cap rates, they run the risk of having to redeploy that capital back out into the same market.

Many buyers, despite being flush with cash, are balking at current prices. And the deeper we get into this cycle, the harder it is to make deals pencil by assuming higher rents and higher occupancy into an uncertain future. I would say the widening of bid/ask spreads right now is a healthy thing, further evidence that market participants are staying somewhat disciplined.

A CRE investor has a couple of different dials he can toggle when making investment decisions: risk profile, return requirement, pace of investment. They are choosing to slow their investment pace instead of loosen their risk profile or lower their return requirements.

Omni: From a commercial real estate perspective, what are the most dramatic potential effects that we should brace ourselves for? In terms of the commercial real estate market, what will you be keeping a close eye on in 2018? What will be driving the volatility in 2018?

I’ll echo my comments from before: CRE fundamentals appear solid with no glaring red flags at the national level. The biggest risk to the commercial real estate market would be a sharp rise in interest rates, likely driven by an unforeseen pickup in inflation that causes the Fed to worry that it’s behind the curve. So far, inflation has been very well behaved.

I’ll be keeping a close eye on the unemployment rate and corresponding wage growth. At this stage in the cycle, with labor markets relatively tight, we’ve typically seen wage pressures materialize. As of the Fed’s most recent statement of economic projections, the Committee expects the unemployment rate to be 4.1% at the end of 2018. We are already at 4.1% as of October 2017. If the unemployment rate were to dip below 4.0% and inflation were to begin moving more quickly back toward the Fed’s 2.0% target, that could elicit a faster pace of rate hikes than is currently expected.

Omni: Do you think market participants are factoring the threat from technology into their investment decisions?

Technology is an interesting topic when it comes to commercial real estate. I think many market participants see CRE as an area of the economy that won’t be as easily “disrupted” by technology, but we’re already experiencing disruption! So much ink has been spilled over the Amazon effect on retail that I don’t need to say much here. WeWork and its $20B valuation, whatever you may think of it, is shaking up the office market. Even if a company doesn’t actually use WeWork space when they want to expand, couldn’t they take a page from their playbook and demand a shorter/more flexible lease in a traditional office building? How would that impact office valuations?

Technology like driverless cars won’t change people’s need to live SOMEWHERE, but it might change the shape of cities and neighborhoods, creating winners and losers. Technology is also changing the way investors think about real estate as an asset class. Priceline is currently valued at $84B while Marriott has a market cap of $46B. In that light, which his more valuable: owning the real estate or owning the customer relationship?

I’m hearing more chatter about how artificial intelligence and machine learning can begin to disrupt the CRE lending market, with algorithms taking the place of human underwriters. It’s easy to envision a company like Zillow disintermediating traditional real estate brokers by facilitating peer-to-peer home sales, and that same model could be extended into the commercial real estate market.

To answer your question (finally), I think it’s important for market participants to consider technological threats…but at the same time, nobody does a very good job of predicting an uncertain future! Picking winners and losers will be as challenging as always.

What appears to be most promising for 2018’s commercial real estate market? What is most concerning? Start a conversation by leaving a comment below!

In case you missed it, be sure to check out part I from our interview series with Robert Calhoun. In our first article, Robert shares insights into the health and future of the United States’ economy as a whole.

——————————————————–

Learn more about Robert Calhoun: Robert Calhoun is the Regional Economist covering the northeast for CoStar Group and is based in New York. Mr. Calhoun manages a team of economists and analysts tasked with producing research at a local, regional and national level on commercial real estate, the economy and capital markets.

Before joining CoStar, Mr. Calhoun was a director of research at Annaly Capital Management, the largest publicly traded mortgage real estate investment trust. There he was accountable for the creation of proprietary research on the US economy, monetary policy and the regulatory environment to drive investment decisions across a portfolio of real estate-related assets that at times was larger than $100 billion. Mr. Calhoun graduated from Clemson University with a Masters in economics and a BA in business management. He also holds the Chartered Financial Analyst designation.

[Online Resources] Real Estate, 2017, 2018, commercial realestate, costar, Economy, insight, local market, national market, prediction, recession, regional market, robert calhoun, technology

Current State of the U.S. Economy and Its Impact on Commercial Real Estate – Part I

Posted on December 7, 2017 by Mike Kushner in Blog, CPBJ Articles, Trends No Comments

Note: This article was published by the Central Penn Business Journal. Click here to read the original version.


With the GOP’s proposed tax bill on its way to conference committee to reconcile the House and Senate versions, Omni Realty Group chatted with CoStar’s Regional Economist for the northeast, Robert Calhoun, about the state of the U.S. economy.

For more than a decade, Robert has been an influential source of economic analysis as it relates to monetary policy and real estate markets. He manages a team of economists and analysts tasked with producing research at a local, regional and national level on commercial real estate, the economy and capital markets.

Through this two part series, Robert shares a wealth of knowledge and insight in his answers to our questions. Let’s take a look at what we can learn about the current state of our economy and the largest threats and opportunities we might encounter in 2018 – Be sure to stay tuned for part II from this series as we diver deeper into commercial real estate and the economy!

Omni: From your perspective, how has 2017 fared? Is the U.S. economy where you thought it would be?

2017 has been another solid year in this recovery. Through three quarters of 2017, real GDP growth has averaged about 2.2% year-over-year, roughly in line with the average since 2010. We are on pace to add another ~2mm jobs this year, and while the rate of job growth has slowed, it’s impressive that we’re still adding this number of jobs in the 8th year of a recovery.

The unemployment rate is down to 4.1% as of October 2017, not only a new low for this cycle but the lowest level since 2000. I expected roughly average growth in 2017, as well as a gradual slowdown in job creation, but I didn’t expect the unemployment rate to fall as much as it has. This took the Fed by surprise as well.

At the end of 2016, the Committee projected the unemployment rate to reach 4.5% by the end of 2017, and I think I was also in that camp. The Fed expected to hike the Fed Funds rate 3 times in 2017, and they are on pace to do exactly that. This is notable: 2017 is the first year in this recovery where the Fed was able to hit their goals for the path of the Fed Funds rate.

Omni: What are your thoughts on Jerome Powell [President Donald Trump’s pick to be the 16th chairman of the Federal Reserve]?

In my opinion, what you get with Powell is monetary policy continuity, which is going to be important for a few reasons. 2018 has the potential to be a challenging year, so there is no reason to amplify that by bringing in a new Chair with radically different ideas about how policy should be implemented.

The Fed intends to begin slowly winding down its mortgage and treasury holdings starting in late 2017, and the taper is set to intensify throughout 2018. Markets are unsure how smoothly this will go, so sticking to the status quo should help smooth out potential volatility. Also, the voting composition of the FOMC swings decidedly more hawkish next year. Picking Powell, a centrist who is already well known to market participants, reduces uncertainty about how the Fed will act in 2018.

Omni: What’s the single biggest threat to the U.S. economy right now? Do you see an economic recession coming anytime soon?

While it would be easy to forecast a looming recession just because the expansion is 8 years old, I’ll paraphrase the Chair of the Board of Governors of the Federal Reserve, Janet Yellen: expansions don’t die of old age. I’m not seeing any alarming imbalances as we have in certain past cycles, and monetary policy is still remarkably loose given how deep we are into this recovery. The biggest threat is probably an unexpected revival of inflationary pressures, which would cause the Fed to raise rates faster, and would cause a spike in interest rates that would be damaging to the economy.

Omni: Generally speaking, has increased regulation been a good thing?

Any increase or decrease in regulation has the effect of moving us along the spectrum between ease of doing business and increased stability. I think I can state, without causing much of an uproar, that going too far in either direction is a bad thing.

Prior to the financial crisis, we had probably gone too far in deregulating certain parts of the financial system, so the increase in regulation that followed is no surprise. That being said, we’re already seeing several bipartisan efforts to reduce the strain from increases in regulation. The House recently passed a bill that would “clarify and amend the High Volatility Commercial Real Estate bank capital rule.” Also, Senate Banking Committee Chairman Mike Crapo (R-IA) is working with a handful of Democrats on a bill that would soften some parts of Dodd-Frank that are considered particularly hard on smaller regional and community banks. The government’s take on regulation is always a pendulum.

What particular insights did you find most compelling? Do you agree or disagree with Robert’s viewpoints? Start a conversation by leaving a comment below!

Now that we’ve taken a broad look at the health and future of the U.S. economy, stay tuned for part II of our interview series with Robert Calhoun to learn more specifically about how the economic climate and emerging technology stand to reshape the commercial real estate market in 2018 and beyond!

——————————————————–

Learn more about Robert Calhoun: Robert Calhoun is the Regional Economist covering the northeast for CoStar Group and is based in New York. Mr. Calhoun manages a team of economists and analysts tasked with producing research at a local, regional and national level on commercial real estate, the economy and capital markets.

Before joining CoStar, Mr. Calhoun was a director of research at Annaly Capital Management, the largest publicly traded mortgage real estate investment trust. There he was accountable for the creation of proprietary research on the US economy, monetary policy and the regulatory environment to drive investment decisions across a portfolio of real estate-related assets that at times was larger than $100 billion. Mr. Calhoun graduated from Clemson University with a Masters in economics and a BA in business management. He also holds the Chartered Financial Analyst designation.

[Online Resources] Real Estate, 2017, 2018, Commercial Real Estate, costar, Economy, federal reserve, forecast, prediction, recession, recovery, regulation, robert calhoun, united states
  • 1
  • 2
  • 3
  • 4

Subscribe To Our Blog

  • This field is for validation purposes and should be left unchanged.

Mike J Kushner, CCIM

  • Contact me for a FREE Lease Review!
  • This field is for validation purposes and should be left unchanged.

Categories

  • About Us
  • Blog
  • CCIM
  • Commercial Real Estate
  • Community
  • Construction
  • CPBJ Articles
  • CREDC Articles
  • Feature
  • Featured Opportunities
  • Guest Blogger
  • Healthcare
  • In the News
  • Industrial
  • Local Market
  • Office Leasing
  • Retail
  • Success Stories
  • Tenant Representative/Buyer Agent
  • Trends

(c) 2019 OMNI REALTY GROUP- Website Design by The John Webster Company