2016 has already proven to be an interesting year for Central Pennsylvania’s retail real estate market. A total of seven new buildings were delivered this quarter alone with a combined RBA of nearly 150,000 square-feet of space – only some of which is occupied. As a result, this new space has impacted vacancy and rental rates as well as net absorption. Here is a more detailed look at some of the highlights from Q1 2016 for Central Pennsylvania retail.
Select Year-to-Date Deliveries:
Seven new buildings were delivered to the Central Pennsylvania retail market in Q1 2016. Six of these properties made it to CoStar’s list of the Philadelphia Market’s Top 15 Select Year-to-Date Deliveries. They are as follows:
- Number 2 on CoStar’s list is the building at I-81 and Walker Road with an RBA of 109,237 square-feet that is 12% occupied.
- Number 7 on CoStar’s list is the building at 968 Norland Avenue with an RBA of 10,500 square-feet that is 71% occupied.
- Number 10 on CoStar’s list is the building at Cedar Crest Crossing with an RBA of 7,310 square-feet that is 100% occupied.
- Number 11 on CoStar’s list is the building at 2101 Strickler Road with an RBA of 7,043 square-feet that is 0% occupied.
- Number 13 on CoStar’s list is the building at Donegal Square with an RBA of 6,108 square-feet that is 0% occupied.
- Number 15 on CoStar’s list is the Chik-Fil-A located at Chambersburg Square with an RBA of 5,000 square-feet that is 100% occupied.
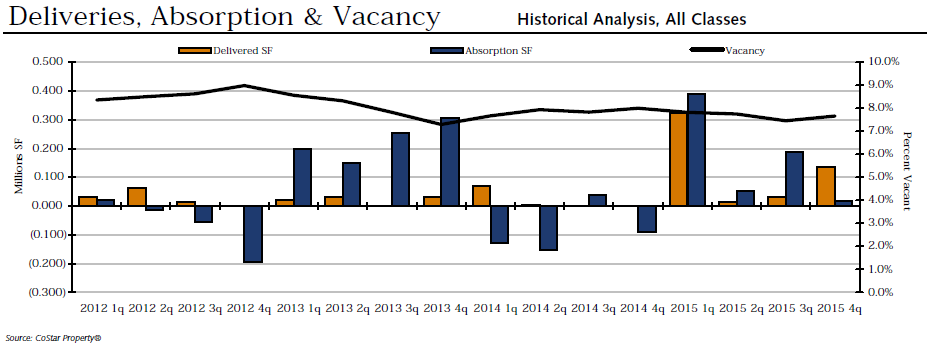
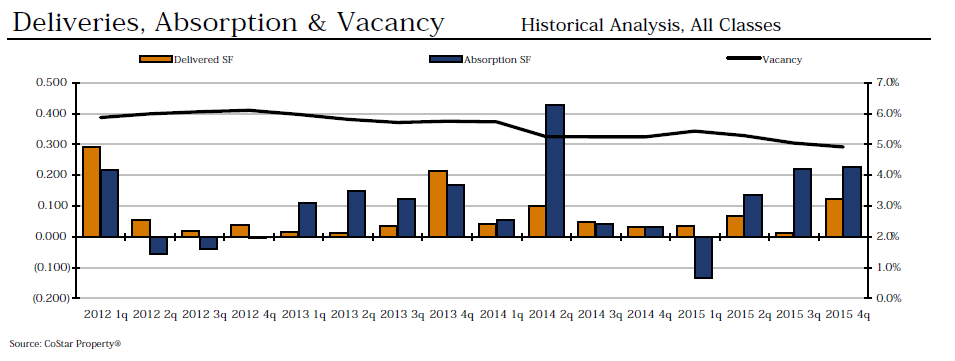
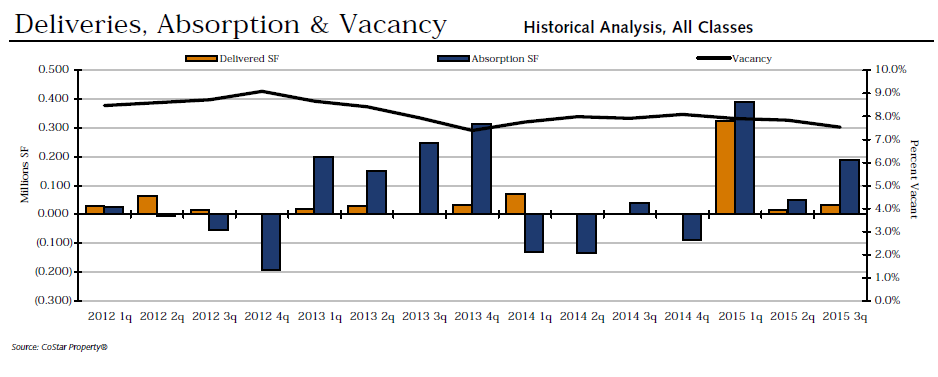
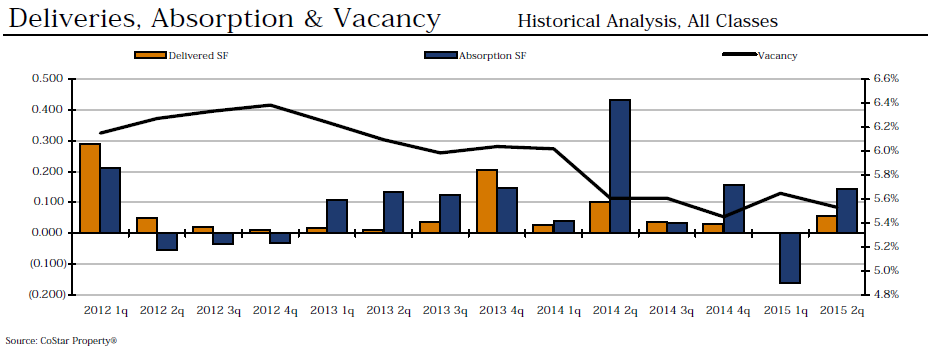
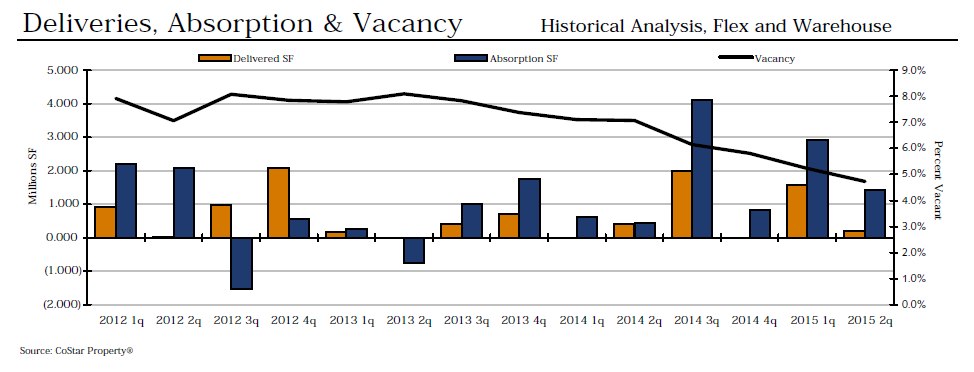
Absorption and Demand:
After hitting a low of negative 152,049 square-feet in first quarter 2015, net absorption has been on a steady climb. However, this trend came to an end this quarter with a significant decrease in net absorption, dropping from 281,270 square-feet (Q4 2015) to 105,984 square-feet (Q1 2016). The seven new buildings, with a combined RBA of 149,898 square-feet, most certainly had an impact on the market’s ability to absorb the new space. It’s also worth noting that Central Pennsylvania comes in second, only behind suburban Philadelphia, in year-to-date net absorption and deliveries.
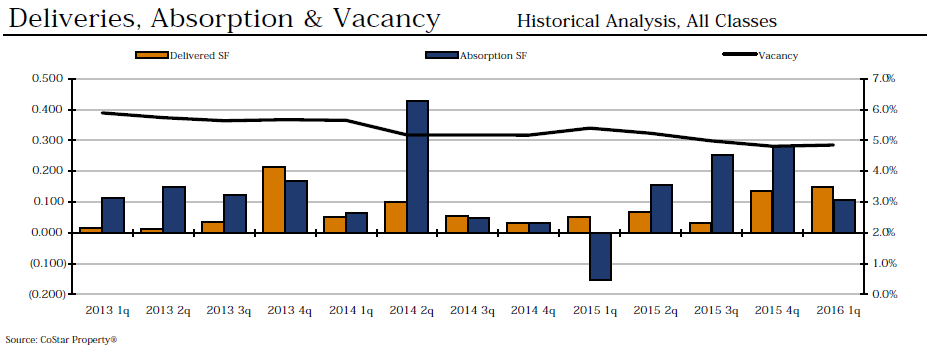
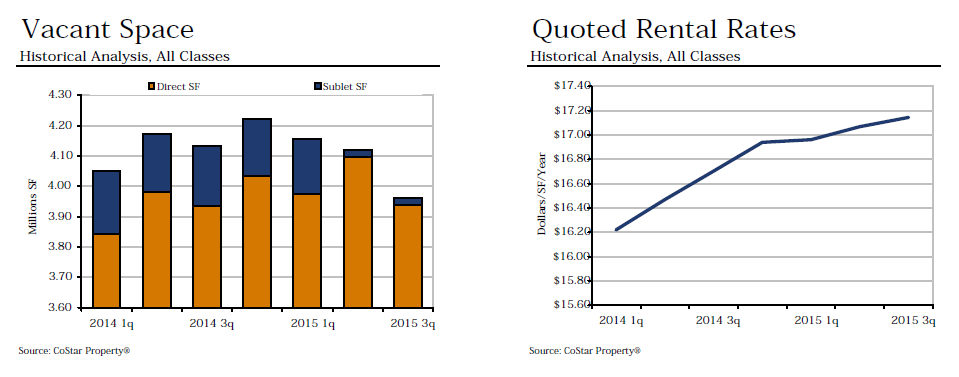
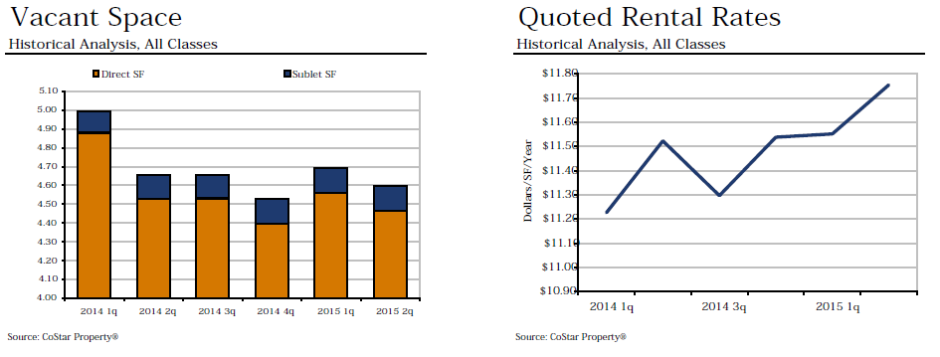
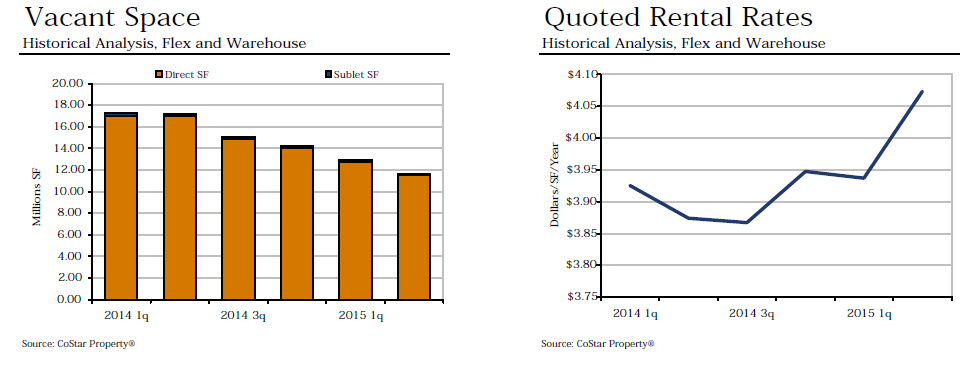
Vacancy:
This quarter the vacancy rate barely budged, increasing from 4.8% to 4.9%. What’s worth noting is that this is one of the very few times we have seen the rate increase during a nearly four-year-long trend of decreasing rates. After hitting a high of 6.0% in the latter part of 2012, rates hit their lowest number last quarter at 4.8%. Could this quarter’s increase be the start of an ongoing trend of increasing rates? The seven new buildings delivered to the market this quarter would indicate yes, which brings us to our next area of focus.
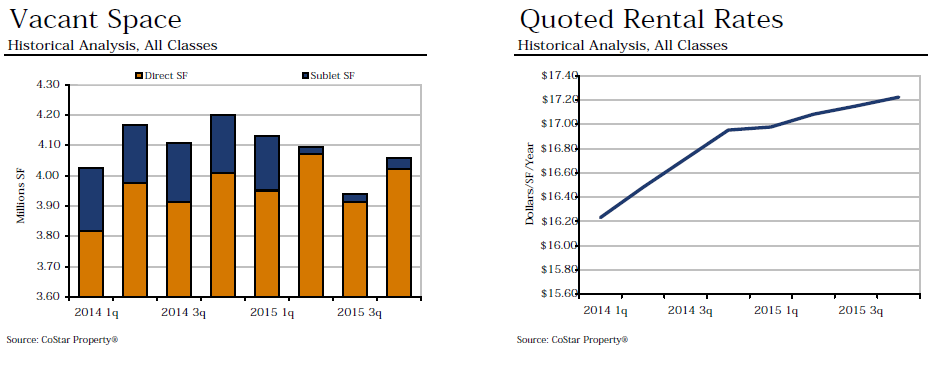
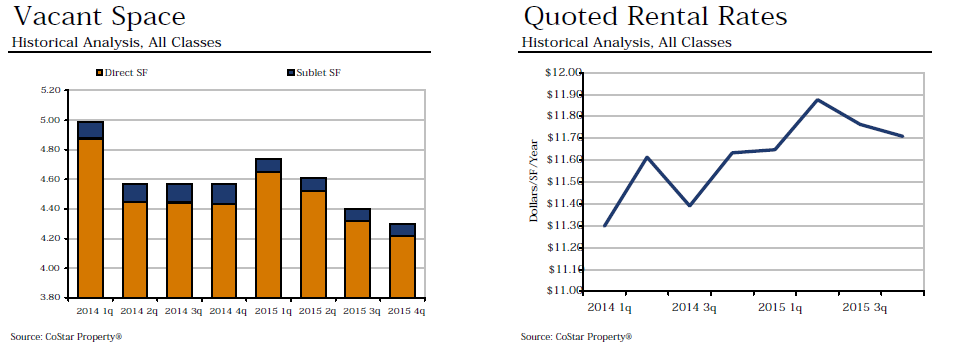
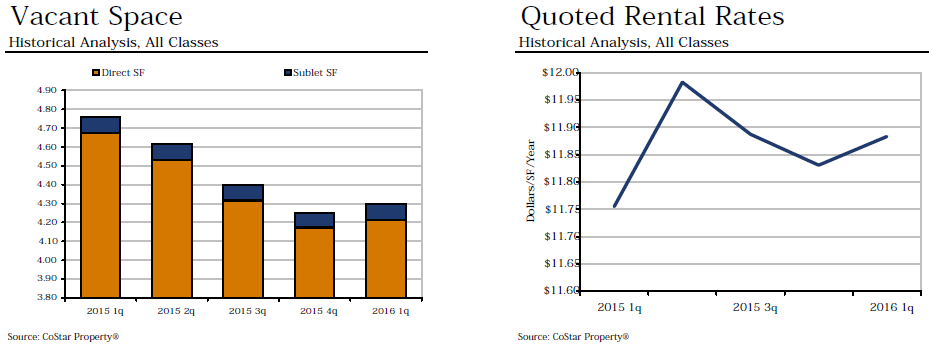
Rental Rates:
Lastly, the quoted rental rates have increased by $0.05, from $11.83 last quarter to $11.88 this quarter, returning them nearly to where they were in Q3 2015. Over the past four years, Central Pennsylvania’s rental rates for retail space have increased and decreased without much consistency. It will be interesting to watch these numbers throughout the rest of the year.
Our Summary/Analysis:
With nearly 150,000 square-feet of new retail space dumped into the market this quarter, Central Pennsylvania has responded to these changes well – all things considered. The vacancy rate moved just ever so slightly and rental rates actually increased, proving the market has a demand for this new space. Further proof is that Central Pennsylvania ranks second to suburban Philadelphia in year-to-date net absorption and deliveries. We should keep a keen eye on how the new construction will continue to impact our local businesses and economy as there is sure to be additional movement and emerging trends!
What trend this quarter do you find most noteworthy? Share your thoughts by commenting below!