OMNI Realty Group
  • Email
  • Facebook
  • Linkedin
  • Twitter
  • Rss
  • Home
  • Omni Advantage
    • Success Stories
    • Our Clients
    • Completed Deals
    • In the News
  • Services
  • Resources
    • Market Reports
    • Local Market
    • Office Space Calculator
    • CCIM Advantage
      • User Investment
      • CCIM Brochure
      • Total Expertise
      • Distinguish Yourself
      • How Would You Rate
  • Global Reach
  • Property Search
  • FAQ
  • Blog
  • Contact Us

Posts tagged "opinion"

Home» Posts tagged "opinion"

Jobs – Not Economy – Drive Commercial Real Estate Activity

Posted on August 22, 2018 by Mike Kushner in Blog, CPBJ Articles, Trends No Comments

Note: This article was published by the Central Penn Business Journal. Click here to read the original version.


Earlier this month, it was reported that the number of Americans filing for unemployment benefits rose less than expected. To put this into perspective, claims dropped to 208,000 during the week of July 14, which was the lowest it has been since December 1969! After peaking at nearly 300,000 claims in October of 2017, we have seen a mostly steady (with some variation) decline in unemployment claims moving forward.

Dropping unemployment numbers indicate a strong labor market. The United States has an estimated 149 million jobs – 19 million more than it did just nine years ago. When you think about that type of job growth, it’s easy to see how it will have an impact on commercial real estate. To accommodate 19 million more workers, businesses have had to add space. Even for jobs that are run outside of traditional office space, there are still many more that do utilize office, retail or industrial real estate to some capacity.

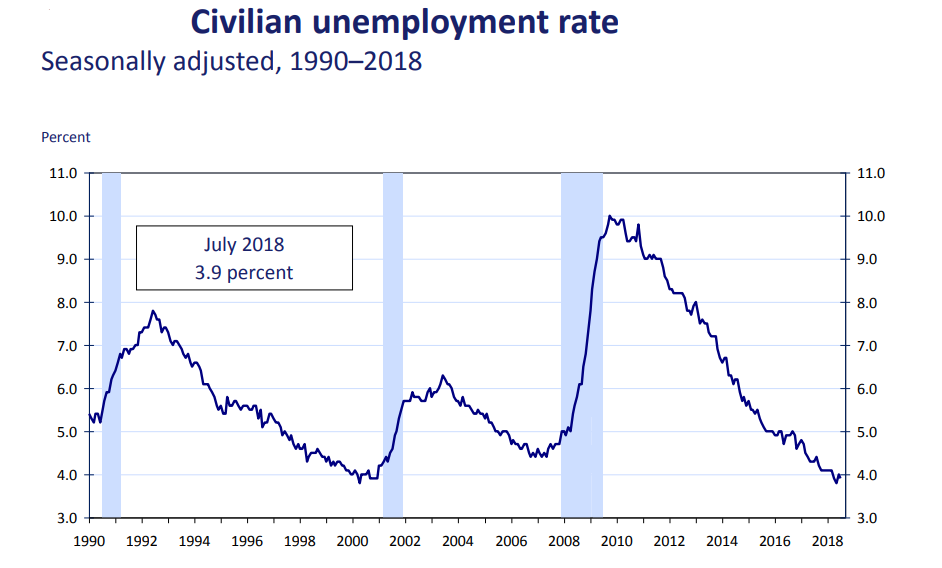
Source: Bureau of Labor Statistics

Many people may assume that it’s the economy that drives commercial real estate activity, but really it’s jobs. The two are closely correlated, but for several compelling reasons jobs have the greater impact and drive businesses to either expand or contract their commercial space.

It all comes down to people and space.

Economic growth is measured by GDP and can be fueled by any number of factors, most of which won’t have a direct impact on commercial real estate. Businesses can earn more money without necessarily needing to hire more people or move into a different commercial location. Though it’s common that when the economy is growing, the commercial real estate industry becomes more active, the true driving force is jobs.

When businesses need more people, they also need more space to accommodate these people. A business using traditional office space is not likely able to hire more than three or so people before working quarters begin to feel a bit crammed. As a result, they move. It is increasing jobs, not just economy, that spurs new commercial real estate activity.

Change doesn’t happen overnight.

There is somewhat of a long tail on job growth driving commercial real estate activity. It takes time to catch up! When businesses are adding employees, they will usually make their current space “work” for as long as possible and then strategically move into a bigger space when they absolutely must. Conversely, when businesses are forced to lay off employees, they often stay in their current space, even if it means some space goes unused. The reason is it’s easier (and less expensive) to lay off employees as the first means of cutting costs than it is to downsize commercial space.

So, the job growth that we’ve seen over the course of many years is now driving the commercial real estate activity we are seeing today.

Slowing, but not stopping.

Job growth peaked in early 2015, then fell steadily through the end of 2017. Since then we have seen a modest, yet mostly steady increase in recent months. The reality is job growth, at any rate, cannot go on forever. The reason is, at some point, the United States will reach its “full employment” where everyone who wants a job, has a job. The unemployment rate, now at 4%, is about as low as it has been since the late 1960s, almost 50 years ago.

For commercial real estate, the link between job growth and space demand is clear and direct, though there may be lags. There will always be businesses who are looking to change their commercial space. Some will want more space, some will want less. Others will want to move to a newer space or will desire a different location. Businesses will close while others open. And so the cycle continues.

Short-Term Impact

Even with economic growth heating up, commercial real estate investors and property owners should not set their expectations for greater space absorption too high, at least in the short-term. Yes, there will be some pick-up in leasing associated with the spike in GDP growth. However, CRE professionals would be wise to focus more on job growth as the gauge for leasing prospects – and this outlook looks much more moderate because the ranks of unemployed workers available is largely exhausted. Looking at the short-term, we should not anticipate significant growth in property leasing this year. The surging industrial sector is the exception, which is the result of the shift from in-store to online shopping, not jobs.

Do you agree that it’s jobs, not the economy, that has the greater impact on commercial real estate activity? Why or why not? Join in the conversation by leaving a comment below.

[Online Resources] Real Estate, advice, blog, central penn business journal, Commercial Real Estate, cpbj, decline, Economy, effect, employment, expert, growth, impact, jason scott, job, jobs, labor, long-term, Mike Kushner, Omni Realty, opinion, rate, short-term, statistics, trends, unemployment

Central Pennsylvania’s Retail Real Estate Market Experiences Record-Setting Quarter

Posted on September 15, 2016 by Mike Kushner in Blog, Local Market, Trends No Comments

This quarter has posted some of the highest and lowest numbers we have seen since 2012. In Central Pennsylvania’s local retail real estate market, vacancy rate is low, rental rate is high and both net absorption and total RBA have increased. But overall, what does this tell us about the state of our economy and what we can expect in future quarters?

Let’s take a closer look at some of the record-setting numbers we experienced in Central Pennsylvania’s retail real estate market in 2016’s second quarter and what they mean to the health of the economy.

Select Year-to-Date Deliveries:

Coming in at number three on the list of select year-to-date deliveries is the retail property located at I-81 and Walker Road in Chambersburg. Phase I and II, delivered in Q1 2016, total 109,237 square-feet of space that is 92% leased (44,000 square-feet with 4,400 square-feet vacant). Some of the major tenants include Kohl’s, Target, Giant, Red Robin, Staples, PetSmart, Michael’s, Olive Garden, VisionWorks, ATT&T and many more. Palisades Development, LLC are currently processing LOIs for the remaining space. Phase III is planned and construction will proceed when leasing warrants.

At number 15 on CoStar’s list, is another Palisades Development, LCC retail property located at 968 Norland Avenue in Chambersburg. This 10,800 square-foot building is 100% occupied and was also delivered in Q1 2016.

Select Top Retail Leases:

On the list of Select Top Retail Leases, Harrisburg area east claimed the top spot. Listed at number one is the Harrisburg East Shopping Center with 69,954 square-feet of space. Although not listed by CoStar’s as a “Select Top Retail Lease” for this quarter, plans are in place for the Giant currently in Colonial Commons, to make a move 0.2 miles down Jonestown Road to the Harrisburg East Shopping Center into the retail space formerly occupied by Gander Mountain. This will provide more space for Giant and is already attracting additional retail businesses nearby including a CVS Pharmacy and potentially a fast-casual restaurant, reports KIMCO, owner of the shopping center.

Select Top Sales:

Only one of the nine Select Top Sales from April 2015-June 2016 is from the Central Pennsylvania submarket. The Shoppes at Susquehanna Marketplace sold for $44,000,000 to Clarion Partners. With an RBA of 110,365 square-feet, this came at a cost of $398.68 per square foot.

Additionally, the West Porte Center, listed by CoStar as a Select Top Retail Lease, is more accurately represented as a sale. PennDOT purchased 67,126 square-feet of land for a new Amtrak station in Middletown that is expected to be finished in 2018. This is estimated to be a $32 million project which will include features like a covered pedestrian bridge to provide direct access to Penn State Harrisburg’s campus.

Absorption and Demand:

Net absorption increased this quarter from 64,467 square-feet (in Q1) to 110,449 square-feet, currently. Total RBA also increased, though just slightly, from 88,822,714 square-feet (in Q1) to 88,854,312 square-feet, currently. Six buildings were delivered with a total RBA of 31,598 square-feet. Additionally, five buildings are under construction.

deliveries-absorptiona-and-vacancy

Vacancy:

This quarter, the vacancy rate decreased by 0.1% to 4.7%. This once again matches the vacancy rate of Q4 2015, which is the lowest rate the Central PA submarket has experienced since prior to Q3 2012.

Rental Rate:

The quoted rental rate increased this quarter by $0.11 to $12.00. This is the highest price per square-foot the local retail real estate market has experienced since prior to Q3 2012.

vacant-space-and-quoted-rental-rate

Our Summary/Analysis:

Q2 2016 provided to be an exciting and record-setting quarter for Central Pennsylvania’s retail real estate market. We experienced a recent record low for vacancy rate at 4.7% and a recent record high for quoted rental rate at $12.00 per square-foot. These two trends go hand in hand, so it’s no surprise they would correlate together.

Another positive indicator for the health of the retail real estate market is the increase in net absorption and total RBA. Though neither were record-setting per se, net absorption nearly doubled in a single quarter which is impressive in its own right. It’s safe to say that the market is growing in demand, increasing in price and is able to absorb the new buildings that have been delivered.

What trend do you think will have the greatest impact on the Central Pennsylvania retail market? Share your insight by commenting below!

[Online Resources] Real Estate, 2016, advice, analysis, blog, building, business, buy, commercial, Construction, costar, data, Economy, expert, facts, growth, lease, market report, Mike Kushner, new, news, numbers, Omni Realty, opinion, prediction, project, q2, retail, sale, second quarter, sell, space, statistics, store, trends

Central PA Retail Market Reacts to 7 New Buildings Delivered in First Quarter 2016

Posted on June 27, 2016 by Mike Kushner in Blog, Local Market, Trends No Comments

2016 has already proven to be an interesting year for Central Pennsylvania’s retail real estate market. A total of seven new buildings were delivered this quarter alone with a combined RBA of nearly 150,000 square-feet of space – only some of which is occupied. As a result, this new space has impacted vacancy and rental rates as well as net absorption. Here is a more detailed look at some of the highlights from Q1 2016 for Central Pennsylvania retail.

Select Year-to-Date Deliveries:

Seven new buildings were delivered to the Central Pennsylvania retail market in Q1 2016. Six of these properties made it to CoStar’s list of the Philadelphia Market’s Top 15 Select Year-to-Date Deliveries. They are as follows:

  • Number 2 on CoStar’s list is the building at I-81 and Walker Road with an RBA of 109,237 square-feet that is 12% occupied.
  • Number 7 on CoStar’s list is the building at 968 Norland Avenue with an RBA of 10,500 square-feet that is 71% occupied.
  • Number 10 on CoStar’s list is the building at Cedar Crest Crossing with an RBA of 7,310 square-feet that is 100% occupied.
  • Number 11 on CoStar’s list is the building at 2101 Strickler Road with an RBA of 7,043 square-feet that is 0% occupied.
  • Number 13 on CoStar’s list is the building at Donegal Square with an RBA of 6,108 square-feet that is 0% occupied.
  • Number 15 on CoStar’s list is the Chik-Fil-A located at Chambersburg Square with an RBA of 5,000 square-feet that is 100% occupied.

Absorption and Demand:

After hitting a low of negative 152,049 square-feet in first quarter 2015, net absorption has been on a steady climb. However, this trend came to an end this quarter with a significant decrease in net absorption, dropping from 281,270 square-feet (Q4 2015) to 105,984 square-feet (Q1 2016). The seven new buildings, with a combined RBA of 149,898 square-feet, most certainly had an impact on the market’s ability to absorb the new space. It’s also worth noting that Central Pennsylvania comes in second, only behind suburban Philadelphia, in year-to-date net absorption and deliveries.

Deliveries, Absorption and Vacancy

Vacancy:

This quarter the vacancy rate barely budged, increasing from 4.8% to 4.9%. What’s worth noting is that this is one of the very few times we have seen the rate increase during a nearly four-year-long trend of decreasing rates. After hitting a high of 6.0% in the latter part of 2012, rates hit their lowest number last quarter at 4.8%. Could this quarter’s increase be the start of an ongoing trend of increasing rates? The seven new buildings delivered to the market this quarter would indicate yes, which brings us to our next area of focus.


Rental Rates:

Lastly, the quoted rental rates have increased by $0.05, from $11.83 last quarter to $11.88 this quarter, returning them nearly to where they were in Q3 2015. Over the past four years, Central Pennsylvania’s rental rates for retail space have increased and decreased without much consistency. It will be interesting to watch these numbers throughout the rest of the year.

Vacant Space and Quoted Rental Rate

Our Summary/Analysis:

With nearly 150,000 square-feet of new retail space dumped into the market this quarter, Central Pennsylvania has responded to these changes well – all things considered. The vacancy rate moved just ever so slightly and rental rates actually increased, proving the market has a demand for this new space. Further proof is that Central Pennsylvania ranks second to suburban Philadelphia in year-to-date net absorption and deliveries. We should keep a keen eye on how the new construction will continue to impact our local businesses and economy as there is sure to be additional movement and emerging trends!

What trend this quarter do you find most noteworthy? Share your thoughts by commenting below!

[Online Resources] Real Estate, advice, analysis, buildings, camp hill, central pa, city, Construction, costar, cumberland, data, dauphin, expert, facts, harrisburg, hershey, lancaster, lemoyne, local, market, mechanicsburg, Mike Kushner, new cumberland, Omni Realty, opinion, pennsylvania, projects, region, report, retail, trends, york

Central PA Industrial Market Booms with New Construction

Posted on May 14, 2016 by Mike Kushner in Blog, Commercial Real Estate, Trends No Comments

Central Pennsylvania is in the midst of a new construction boom when it comes to industrial real estate. Last quarter, eight new buildings were delivered to the market and this quarter, we see another five new properties reach completion. Additionally, five more buildings are under construction and set to be delivered later this year. Combined, this is millions of square-feet of space, with much of it not yet occupied or preleased.

How is this new construction trend impacting the local market? Moreover, what can it tell us about the health of the local economy? Here is summary of the data from first quarter 2016 for the Central Pennsylvania industrial submarket that provides insight to help answer these questions.

Select Year-to-Date Deliveries:

Five of the top nine Select-Year-to-Date Deliveries for first quarter 2016 are located within the Central Pennsylvania submarket. Coming in at number two on the list is 575 Old Forge Road. This property has an RBA of 500,000 square-feet and is 0% occupied. Number four on the list is the Susquehanna Logistics Center with an RBA of 4323,300 square-feet and is also 0% occupied. The third of the five Select-Year-to-Date Deliveries in Central Pennsylvania comes in at number seven on the list. It is located at 1165 Strickler Road with an RBA of 40,000 square-feet and is 100% occupied. Next, at number eight on the list, is 551 Manchester Court with an RBA of 36,000 square-feet and is 100% occupied. Finally, at number nine is 211 Piper Circle with an RBA of 26,825 square-feet and 45% occupied.

Select Top Under Construction Properties:

The incredible amount of new space being pumped into the Central Pennsylvania industrial real estate market is only going to continue to increase as five more properties are under construction and expected to be delivered in 2016. These properties include: Lebanon Valley Distribution Center with an RBA of 874,126 square-feet; Eden Road Logistics Center with an RBA of 755,421 square-feet; Trade Center 44 with an RBA of 620,000 square-feet; 192 Kost Road with an RBA of 422,400 square-feet; and LogistiCenter 78-81 with an RBA of 405,000 square-feet. All five properties are 0% preleased.


Absorption and Demand:

Net absorption has dropped significantly since last quarter. Previously at 1,730,592 square-feet in fourth quarter 2015, it ended first quarter 2016 at 123,946 square-feet. Contributing to this trend is the delivered inventory of five buildings this quarter and eight buildings last quarter with a combined impact of 3,904,745 square-feet of new space in six short months!

deliveries, absorption and vacancy

Vacancy:

This quarter, the vacant square footage jumped from 13,451,560 to 14,353,739. The vacancy % jumped from 5.3% to 5.6%, which is the highest we have seen it since fourth quarter 2014. Compared to the vacancy % that was in the 6’s and 7’s prior to second quarter 2014, this is still moderate to low, but it is showing a trend of increasing over the last year.

Rental Rates:

The quoted rental rates have increased by $0.11, from $4.11 last quarter to $4.22 this quarter. This is the highest quoted rental rate the Central Pennsylvania industrial submarket has seen since prior to second quarter 2012.

vacant space and quoted rental rate

Our Summary/Analysis:

Although net absorption dropped significantly and large amounts of space continues to be added to the market, I believe that the demand for space will continue to soar.  The whole chain of moving goods, from producer to consumer, is being upended by consumer shifts toward e-commerce, to the advantage of wholesalers and warehouse space, generally. Other demand drivers are also firing strongly, in concert with the continuing economic recovery.  As with other property sectors, demand for space naturally rises with GDP growth and especially job growth.

But industrial demand depends on two factors, in addition to retail demand: trade and housing construction.  Warehouses benefit from housing construction as home builders need large spaces in which to store their materials.  Housing stats are not at the level of the mid 2000’s. But volumes have recovered nicely since the recession, with the annual rate now up to 1.1 million units, twice the rate at the depth of the recession and finally approaching the levels of the mid 1900’s prior to the housing boom.

And trade is up, building on a long upward trend for both imports and exports dating back at least 50 years due to greater trade liberalization. Exports and imports combined have tripled their share of our nation’s Gross Domestic Product, from less than 10% in the 1960’s to almost 30% now. Our growing trade means that an increasing share of products that we buy and sell, end up in warehouses at some point in their journey from producer to consumer.  Putting all these factors together – rising trade, increasing housing construction, and the shift to e-commerce, all in the context of at least moderate economic growth – provide fuel for strong tenant demand for warehouse space.

How do you anticipate the boom in new industrial real estate space will impact the local market and economy? Share your insights by commenting below!

[Online Resources] Real Estate, advice, analysis, blog, camp hill, central pa, commercial, cumberland, data, dauphin, expert, harrisburg, industrial, lancaster, market, mechanicsburg, Mike Kushner, new cumberland, news, numbers, Omni Realty, opinion, pennsylvania, report, statistics, trends, york

Central PA Welcomes More Office Space, Rising Rental Rates

Posted on April 11, 2016 by Mike Kushner in Blog, Local Market, Trends No Comments

Overall, 2015 has proven to be an active and eventful year for Central PA office real estate. Six new buildings were delivered into the market with four more under construction. The vacancy rate rose slightly, but remains lower than it has been in recent years. Additionally, net absorption dropped by nearly 175,000 square-feet, though it still remains in the black.

How has this activity impacted the market? And how do we anticipate it will reflect on the local economy? Let’s first take a look at the numbers to help guide our predictions for the market’s performance in 2016 and beyond.

Select Year-to-Date Deliveries:

Six of the top 15 Select Year-to-Date Deliveries are within the Central PA submarket. Looking at just those that were delivered specifically in fourth quarter 2015, there are two worth noting. Coming in at number three on the CoStar list is the office building at 1250 Camp Hill Bypass. This building has an RBA of 82,000 square-feet and is 100% occupied. It broke ground in fourth quarter 2014 and was delivered one year later. Next is the Cornwall Health Center coming in at number five on the list. Located at 1701 Cornwall Road in Lebanon, this building has an RBA of 54,234 square-feet and is 100% occupied. This multi-million dollar project is estimated to bring a burst of new jobs to the area.

Vacancy:

This quarter, we saw the vacancy rate rise ever so slightly from 7.5% to 7.7%. This returns the market closer to where it began the year, but is still lower than where we were one year ago at this time when the vacancy rate was 8.0%. Still, the overall trend is a decrease in vacancy rates. Comparatively to 2013 and prior, the vacancy rates were consistently at 8.0% or greater.

Absorption and Demand:

Net absorption took a major hit this quarter, dropping from 189,032 square-feet in Q3 to 15,921 square-feet in Q4. This is the lowest the absorption rate has been since one year ago at this time when it was negative 90,015. Overall, absorption rates in the Central PA office submarket have been volatile and hard to predict, often increasing or decreasing by more than 100,000 square-feet each quarter and dipping into the red a total of five times since Q1 2013.

Image from CoStar

Image from CoStar

Rental Rates:

The quoted rental rates increased ever so slightly this quarter by $0.07 to $17.22. This continues a steady climb in rates that began at the start of 2013. Since that time, they have increased by a total of $1.11. This is also the highest rental rate we have seen in the Central PA submarket since prior to Q1 2012.

Image from CoStar

Image from CoStar

Our Summary/Analysis:

Looking to the future, we can expect even more square footage to be added to the local market in 2016 as four buildings, currently under construction, will be delivered between the first and third quarters. Combined, these new buildings will contribute 277,590 square-feet of office space. This will have an impact on nearly all aspects of the market including net absorption, existing inventory, delivered inventory and vacant square-footage.

As for the health and strength of the Central PA submarket, the seemingly ever-increasing rental rate is a sign that businesses are demanding more space and willing to pay for it. And with the majority of year-to-date deliveries and under-construction projects nearly fully occupied, new office space continues to be in-demand.

What fourth quarter 2015 market trend do you find most interesting or impactful? Share your insights by commenting below!

[Online Resources] Real Estate, 2015, 2016, absorption, analysis, blog, business, camp hill, central pa, costar, demand, development, Economy, facts, fourth quarter, growth, harrisburg, health, hershey, lancaster, lemoyne, market, mechanicsburg, Mike Kushner, new cumberland, numbers, office, Omni Realty, opinion, pennsylvania, rent, rental rate, report, statistics, trends, vacancy, york

The Truth About Real Estate Commissions

Posted on March 2, 2016 by Mike Kushner in Blog, Commercial Real Estate, Tenant Representative/Buyer Agent No Comments

Omni Realty Header Image

When it comes to real estate transactions, everyone knows that commissions are involved; it’s how brokers get paid! But what’s not so common knowledge are the various details surrounding these commissions like who actually gets paid, who’s responsible for paying and how much is owed.

Whether you’re the tenant or landlord in the deal, you’ll want to have clear answers to all of these questions before working with a broker or proceeding with any real estate deal. Understanding the “fine print” will help alleviate the stress and potential pitfalls of being uninformed regarding commissions.

Let’s take a look at some of the most essential questions surrounding this important real estate topic…and their answers!

What parties earn a commission?

Typically, a commission is paid to both the listing agent/landlord representative and the tenant representative, if a real estate transaction has both of these parties involved and they are different from one another (here’s why they should be!).

It’s important to note that if you are a tenant looking for a property, you will want to have your tenant representative with you from the very first time you see a property.  If another agent (whether you know them/asked them or not and regardless of whether they represent both buyers and sellers) bring you to a property, he/she is legally entitled to a portion of the leasing commission as the “procuring” agent.

You may never see this agent again or benefit from their advice/expertise, but since that agent showed you the property, that agent will be paid a commission. This complicates the situation if you should choose to then hire a tenant rep different from the initial agent who showed you the property – and a commission dispute may ensue. To avoid all this trouble, it is best to establish your tenant rep from the beginning and have only him or her show you properties!

Who is responsible for paying this commission?

After a lease is signed, it is typically the responsibility of the landlord (or property owner) to pay a commission to both the listing agent/landlord representative and the tenant representative. As the tenant, it is not usually assumed to be your responsibility to pay a commission to your broker. This is paid by the landlord at the time the lease is executed, unless otherwise negotiated.

How is the amount of commission determined?

The cost of commission varies and commission is most often calculated as a percentage of the lease value (also referred to as “total consideration”). When the signed lease has been executed and the tenant takes occupancy, generally one-half of the commission (paid by the landlord) is paid to the landlord rep and one-half of the commission is paid to the tenant rep.

For example, a tenant signs a 3-year lease for a 2,000 square-foot space at $20 per SF per year. The total consideration = $120,000 (2,000 SF * $20/SF per year * 3 years). The property owner pays a 6% commission (one-half to landlord rep and one-half to tenant rep). The total commission = $7,200 ($120,000 * 0.06).

It’s also worth noting that an agent may “split” their total piece of the commission, sharing it in some proportion with their broker. Commission splits range anywhere from 50/50 (most common) to 90/10, in favor of the agent.

Real estate services are NOT free.

Real estate transactions typically include commissions that are shared by the agents or advisors representing each party. Even though the property owner writes the commission check, it’s ultimately the tenant that funds the commission – in the form of rent payments (for leases) or purchase proceeds (for sales). Make certain that you are receiving full value from your “side” of the commission by having an unbiased, experienced, licensed real estate advisor assist you with the research for suitable spaces and in the negotiation of acceptable terms and conditions.

Do you have another question about real estate commissions that wasn’t answered in this article? Ask us!

[Online Resources] Real Estate, advice, agent, answers, broker, buyer, Commercial Real Estate, commission, commissions, expert, information, landlord, lease, Mike Kushner, money, negotiation, Omni Realty Group, opinion, owner, paid, pennsylvania, property, questions, representative, seller, tenant, total consideration, truth

Central PA Proves Its Increasing Demand for Retail Real Estate Q4 2015

Posted on February 10, 2016 by Mike Kushner in Blog, Local Market No Comments

Retail real estate investors and consumers alike should be excited about the market trends we experienced in fourth quarter 2015!

There are several strong indicators that the local market is healthy, growing and catching the eye of some major retailers like Field and Stream. The highlights from the most recent quarter include the lowest vacancy rate since prior to 2012 even with a continual increase in inventory as four new buildings were delivered this quarter. Additionally, a positive and increasing net absorption demonstrates the market’s ability to handle the new space while still growing in demand.

What else can we learn from how the retail real estate market in Central PA performed at the close of 2015? Let’s take a look at more important trends worth noting…

Select Year-to-Date Deliveries:

Specifically this quarter, we saw two new retail spaces delivered to the Central PA submarket that made it to the top 15 list for the Philadelphia market. Coming in at number 11 is the retail building at 4250 Chambers Hill Road in Harrisburg. This 59,400 square-foot space is 100% occupied by Restaurant Depot. Coming in at number 12, the Central PA market gained a new Field and Stream near the Capitol City Mall in Camp Hill that delivered 50,000 square-feet of new space to the market and is also 100% occupied.

Select Top Sales:

Among the nine select top sales highlighted in the fourth quarter for the Philadelphia market, just one occurred in the Central PA submarket. The 171,069 square-feet Lowe’s building located at 250 S. Conestoga Drive in Shippensburg was sold by Excel Trust, Inc. to the ARC Companies for $24,250,000.

Vacancy:

In fourth quarter 2015, the vacancy square-footage and vacancy rate dropped ever so slightly from the previous quarter, but overall these are the lowest numbers we have seen since prior to 2012! The vacant square footage is 4,295,660 and the vacancy rate is 4.9%. This is the first time we are seeing the vacancy rate drop into the 4’s since at least four years ago.

Rental Rates:

2015 finished the year with retail rental rates at $11.71. While this did not set any all-time low or high records for recent quarters, it is a slight decrease from the $11.76 we ended with in the third quarter. With the highest peak in recent history occurring in the second quarter of 2015 at $11.88, it will be interesting to see if this decreasing trend continues into 2016 and beyond.

vacant space quoted rental rates

Absorption and Demand:

Net absorption increased this quarter to 227,275 square-feet. A total of four new buildings were delivered to the market (two we just discussed) which contributed an RBA of 124,295 square-feet. The total RBA of existing inventory rose to 87,242,952 square-feet which is the highest we have seen since prior to 2012. Historically, total RBA has been on a steady climb for nearly four years and counting. 

deliveries absoprotion and vacancy

Our Summary/Analysis:

Fourth quarter 2015 delivered good news and positive signs of growth for the Central PA retail real estate market. We experienced the lowest vacancy rate in recent history, dropping into the 4’s with a rate of 4.9%.

What’s most impressive is that this decreasing vacancy rate occurred during a quarter in which inventory also increased, four new buildings were delivered to the market and nine new buildings are still under construction. The positive (and increasing) net absorption tells us that the local retail market is well-poised to handle this new inventory and that businesses are growing and expanding into Central PA.

Based upon the activity in the Central PA submarket for retail real estate in fourth quarter 2015, what do you think will have the greatest impact on our local economy? Share your thoughts by commenting below!

[Online Resources] Real Estate, 2015, analysis, blog, commercial, Construction, costar, data, deliveries, expert, field and stream, fourth quarter, leases, local, lowe's, market, Mike Kushner, news, Omni Realty, opinion, prediction, q4, report, retail, sales, statistics, summary, trends

Back in Black: Central PA Retail Market Increases Net Absorption, Rental Rates in Q2

Posted on September 23, 2015 by Mike Kushner in Blog, Local Market, Trends No Comments

It is a good time to be building or renting retail space in Central Pennsylvania!

Second quarter 2015 closed out with the highest quoted rental rate we have seen since at least 2011. Retail businesses are willing to pay the $11.75 per square foot – and more – to move into highly sought after space in Harrisburg, Lancaster, York and the surrounding areas.

Combine this with the fact that the market absorbed a combined 144,318 square feet of space, bringing us back into the black with net absorption, and you can see why we’re hopeful that this is the start of a healthy and prosperous trend in Central PA real estate.

Let’s take a deeper dive into what the numbers are telling us about second quarter 2015 and what we can expect for the future of retail real estate in the Central Pennsylvania submarket.

Select Top Retail Leases

Properties all across the Philadelphia retail market continue to change hands as businesses exit and enter leases. Looking specifically at the Central Pennsylvania submarket, there are several retail leases that occurred in second quarter 2015 that are worth noting.

Blue Mountain Thrift Store now occupies the space at 2 N. Londonderry Square in Harrisburg Area East. In Harrisburg Area West, Peebles moved into the Shippensburg Shopping Center. And finally York County welcomed CSL Plasma into its Eastern Boulevard Plaza.

Select Year-to-Date Deliveries:

Three of the top 10 year-to-date deliveries in the Philadelphia retail market occurred in the Central Pennsylvania submarket. The Messina Highlands project in Shrewsbury was completed this quarter with an RBA of 30,000 square feet and a quoted rental rate of $26.06. A ton of popular shops including AT&T and Panera Bread will occupy this space. Currently, 32% of the space is still available for rent.

Another retail property located at 2108 S. Queen Street, York was delivered this quarter with an RBA of 16,000 square feet and is 100% occupied. Finally, the construction project at 750 Lititz Pike, Lititz was also completed in Q2. This property has an RBA of 10,820 square feet and its quoted rental rate is $17.

Select Top Sales:

Among the top select sales in Q2, the Central Pennsylvania submarket had two of the top nine on the list. The Shoppes at Susquehanna Marketplace in Harrisburg came in at number three. Clarion Partners purchased this from Stanberry Development, LLC for $44,000,000. In Lancaster, the Manor Shopping Center was sold by the Real Estate Equity Company, LLC to Wharton Realty Group for $34,990,000.

Vacancy:

This quarter, the vacancy rate dipped ever so slightly from 5.6% to 5.5%. These numbers have remained fairly stable ever since first quarter 2014 which is the last time we saw it at 6.0% or higher. The vacant square feet also reflected this small change in vacancy rate, decreasing by 93,642 square feet.

Rental Rates:

Looking at the quoted rental rates, Q2 experienced a $0.20 raise from $11.55 to $11.75. This is the highest rental rate we have seen in the Central Pennsylvania retail submarket since third quarter 2011.
vacant space and quoted rental rate
Absorption and Demand:

Last quarter, the net absorption dropped into the red at negative 160,861 square feet. In second quarter 2015, we are back in the black with 144,318 square feet. This significant change was certainly a reflection of the 3 new buildings that were delivered this quarter.

Deliveries Absorption and Vacancy

Our Summary/Analysis:

The Central Pennsylvania submarket experienced some exciting changes in second quarter 2015 that indicate a healthy and growing retail industry. Returning to a positive net absorption and increasing quoted rental rates to the highest they have been in more than four years demonstrates the demand for retail space in the local area. Additionally, three new buildings delivered to the market, with two more under-construction, are signs that Central Pennsylvania retail businesses are demanding more space to grow!

The retail industry is a strong indicator of economic health. At the local level, there is a lot we can take from this quarter’s numbers and apply them toward predicting the growth and changes in our overall economy. Retail businesses are investing in this area, moving and expanding into new spaces that are driving up net absorption and the quoted rental rate. We should enjoy this growth and excitement, as it is sure to catch the attention of other retail businesses who may also consider making Central Pennsylvania “home” for some of their stores.

How will the growth of the local retail real estate market impact you or your business? Share your personal insights – or ask a question by commenting below!

[Online Resources] Real Estate, advice, blog, camp hill, central pennsylania, commercial, costar, cumberland, data, dauphin, economic, Economy, expert, finance, harrisburg, health, hershey, lancaster, market, mechanicsburg, Mike Kushner, news, Omni Realty, opinion, pa, pennsylvania, report, retail, space, statistics, trends, writing, york

The Obamacare Effect on Local Real Estate

Posted on September 6, 2015 by Mike Kushner in Blog, Commercial Real Estate, CPBJ Articles, Healthcare No Comments

Note: This article was originally published by the Central Penn Business Journal. Click here to read the original version.

The Obamacare Effect on Local Real EstateNo matter your age, income or current bill of health, in some way or another, we will all be impacted by the major changes taking place in the health care industry nationwide.

The Affordable Care Act, or Obamacare, represents the most significant overhaul of the U.S. health care system since the passage of Medicare and Medicaid in 1965.

While it’s easy to predict the industries where these waves of change will come crashing down the hardest, less obvious industries, like commercial real estate, have also felt the impact of these ripples — and there are more to come.

For real estate investors, the big question is what impact this regulatory overhaul of health care mandates, subsidies and insurance exchanges will ultimately have on the commercial market. The best clues can be found in the emerging trends taking place in local health care real estate across the region.

Simply put, there are two major trends we should be watching closely right now.

Monetization

Noncore real estate, such as medical office buildings and outpatient facilities, have become a common asset that health care systems are monetizing first to help stay financially afloat. Selling off real estate and consolidating square footage is a necessary tool for health care systems right now. Here’s why.

1. Provide an infusion of capital for core investments. Selling off noncore real estate assets can provide health care systems with a quick and significant infusion of cash, allowing them to reinvest this capital back into essential items like construction, renovation and upgraded medical equipment.

2. Focus on strategic growth. Rather than holding on to an underperforming or noncore real estate asset, health care systems are selling them off and using this money to prioritize physician recruitment and retention, clinical expansion and growing their market share.

3. Strengthen balance sheet. The capital gained from monetization will improve liquidity — and a health system’s balance sheet as a result — allowing it to earn a better credit rating.

4. Reduce legal and regulatory exposure. More properties mean more opportunities for a costly violation. Health care systems benefit from reduced legal and regulatory exposure by monetizing their noncore real estate assets.

Mergers and Acquisitions

Some of Central Pennsylvania’s largest health care systems have engaged in discussions regarding merging or acquiring another facility. Specifically, four different mergers have already taken place or are currently in the works, each for unique reasons, but with the same goal in mind — to rein in costs and expand access.

1. PinnacleHealth (JC Blair Health System) and Penn State Hershey (St Joseph Regional Health Network). The most compelling reason for this merger is the projected economic savings. The recurring long-term savings is estimated to be at least $86 million annually through avoided capital and operating costs.

2. Holy Spirit and Geisinger (AtlantiCare Regional Medical Center and health care system, Shamokin Area Community Hospital, Bloomsburg Health System and Lewistown Hospital). In this “affiliation,” a small Catholic health system formally joins with a large, technologically-advanced system in an effort to continue to make health care accessible and affordable to the most people.

3. Lancaster General and University of Pennsylvania Health System. One of the largest benefits of this merger, aside from their entry into a new market, is the ability for patients to receive treatment at one facility and follow up at another. LG Health President and CEO Tom Beeman identified health care reform as the driving force behind this merger.

4. WellSpan (Good Samaritan, Ephrata Community Hospital and Philhaven).Wellspan/Good Samaritan is primarily focused on physical health while Philhaven specializes in behavioral conditions and mental health. Combined, these organizations will be better equipped to serve a broad range of patients at a fraction of the cost of trying to add these specialties independently.

The future

The velocity at which the health care industry is changing cannot be overestimated. While we are already experiencing disruption and change resulting from health care reform, technology, big data, regulatory and other impactful forces in the health care industry, I believe it is simply too soon to accurately predict the full impact these changes will have on the commercial real estate industry.

Despite the many uncertainties surrounding the hot-button issue of health care reform, there is one certain conclusion I will draw. Health care systems are prepared (and have already begun) to proactively make changes to their real estate in an effort to stay afloat.

They will do whatever it takes, even if this means selling off large properties or merging with/acquiring another health care system. We should be prepared to continue to see health care systems tighten up and team up to make their services efficient and competitive.

While there are many more changes yet to come, ones that are sure to be both positive and negative, the real estate industry should remain ready to quickly react to the changing needs of health care systems during this time.

Read more by Mike Kushner on CPBJ.com…

Regional rental demand: What it means for economic growth

[Online Resources] Real Estate, aca, acquisition, affordable care act, article, camp hill, central penn business journal, central pennsylvania, Commercial Real Estate, cpbj, data, facts, harrisburg, health, healthcare, hershey, hospital, information, lancaster, local, market, mechanicsburg, medical, merger, Mike Kushner, news, obamacare, Omni Realty, opinion, pinnacle, report, statistics, trends, writing, york

How Major Healthcare Mergers are Impacting Commercial Real Estate

Posted on March 23, 2015 by mike.kushner in Blog, Commercial Real Estate, Healthcare, Trends No Comments

It goes without saying that major changes are taking place in the healthcare industry nationwide. The Affordable Care Act otherwise known as “Obamacare” became effective January 1, 2014. This legislation represents the most significant overhaul of the U.S. healthcare system since the passage of Medicare and Medicaid in 1965. For real estate investors, the big question is what impact this regulatory overhaul of mandates, subsidies and insurance exchanges will have on commercial real estate.

growing mismatch between hospital supply and demand

Here is a quick glance at some of the most compelling trends taking place in hospital supply and demand. It illustrates the struggles healthcare systems are facing to stay in business.

There is no doubt a wave of consolidations is reshaping the U.S. healthcare industry. Generally, in a merger, the smaller hospital is looking to increase its financial stability and gain access to capital. The larger one is looking to increase market share and the number of patient referrals it gets from doctors.

As a result, we’re starting to see more and more mergers between healthcare systems who want to team up to remain competitive. In Central Pennsylvania alone there are four main examples of mergers taking place, each for unique reasons, but with the same goal in mind – to rein in costs and expand access. Let’s take a closer look at each one.

1. PinnacleHealth (JC Blair Health System) and Penn State Hershey (St Joseph Regional Health Network)

In January 2015, the same time in which the Penn State Board of Trustees announced its approval of the propose acquisition of St. Joseph Regional Health Network, the Board also announced its approval of the proposed merger with PinnacleHealth. From Penn State’s perspective, the benefits are obvious. This merger will allow them to grow a long-term patient and revenue base to better support its academic and research missions.

Additionally, the merger will allow Penn State Hershey to have lower-acuity patients treated at one of Pinnacle’s three hospitals, freeing more beds at the medical center for higher-complexity cases that a teaching hospital can best serve. As a result, this will help to increase hospital occupancy rates at both PinnacleHealth and Penn State Hershey.

Possibly the most compelling reason for this merger is the projected economic savings. The first five years should create at least $260 million in savings for both entities through avoided capital and operating costs. The recurring long-term savings is estimated to be at least $86 million annually. It was agreed upon that Penn State University will be the parent entity in this merger. Final action is tentatively scheduled for later this month.

2. Holy Spirit and Geisinger (Atlanticare Community Medical Center Healthcare System, Shamokin Area Community Hospital, Bloomsburg (PA) Health System, and Lewistown (PA) Hospital)

In this merger (more appropriately referred to as an “affiliation”), a small Catholic health system formally joins with a large, technologically-advanced system in an effort to continue to make healthcare accessible and affordable to the most people. Now as a Geisinger Affiliate, Holy Spirit will undergo some major upgrades including an expanded emergency room, improved electronic infrastructure (with an emphasis on electronic medical records) and use of technology to deliver evidenced-based treatments.

In return, Geisinger receives an entry into the highly competitive Harrisburg healthcare market. PinnacleHelath just recently opened a $100 million hospital within a few miles of Holy Spirit in Cumberland County. While there are currently no major plans to downsize, the Holy Spirit-Geisinger union maintains that this aspect of the hospital will be continually monitored and adjusted as needed.

3. Lancaster General and University of Pennsylvania Health System

Earlier this month, Lancaster General Health and University of Pennsylvania Health System signed a non-binding letter of intent to negotiate a definitive agreement for their merger. Each organization brings a unique size, focus and geography that differs from the other. One of the largest benefits of this merger, aside from their entry into a new market, is the ability for patients to receive treatment at one facility and follow-up at another.

LG Health President and CEO Tom Beeman identified healthcare reform as the driving force behind this merger (and many of the other mergers we are presently seeing). To survive, Beeman said, it’s pretty clear nonprofit systems are “going to have to have a critical mass in the $5 billion to $10 billion range.”

The terms of the proposed deal between Lancaster General Health and University of Pennsylvania Health System will remain confidential until both parties approve it, but things are expected to move forward in the coming weeks.

4. WellSpan (Good Samaritan, Ephrata Community Hospital and Philhaven)

In October 2014, Wellspan (which was in the process of taking control of Lebanon’s Good Samaritan Health System) announced that it was also exploring a partnership with Philhaven behavioral services. Much like many of the other mergers, they said the purpose is to allow all organizations to work more efficiently and better manage costs to improve health outcomes and the patient experience.

In this particular merger, each healthcare system brings a slightly different focus. Wellspan/Good Samaritan is primarily focused on physical health while Philhaven specializes in behavioral conditions and mental health. Combined, these organizations will be better equipped to serve a broad range of patients at a fraction of the cost of trying to add these specialties independently. In addition, Ephrata Community Hospital became an affiliate of WellSpan in 2013.

The Impact on Commercial Real Estate

The velocity at which the healthcare industry is changing cannot be overestimated. While we are already experiencing disruption and change resulting from healthcare reform, technology, big data, regulatory and other impactful forces in the healthcare industry, it is simply too soon to accurately predict the full impact these changes will have on the commercial real estate industry.

Despite the uncertainty, we are seeing a number of trends such as an increasing demand for MOBs and heightened activity in this asset class, both of which reflect the healthcare industry’s changing real estate needs. The demand for primary and urgent care facilities is already strong, with so many changes underway and record-breaking medical practice consolidations and mergers, as well as acquisitions of medical practices by large facilities also taking place.

While many changes may reflect the cyclical nature of real estate, the questions remain to what extent the cycle will be guided by outside forces and how investors will respond.

What is your prediction for the future of healthcare real estate? Join in the conversation by commenting below!

[Online Resources] Real Estate, assets, blog, camp hill, central pennsylvania, commercial, cumberland county, dauphin county, facility, harrisburg, health, healthcare, hershey, insight, local market, medical, Mike Kushner, monetization, Omni Realty, opinion, pa, penn, penn state, pinnaclehealth, prediction, trends, writing

Subscribe To Our Blog

  • This field is for validation purposes and should be left unchanged.

Mike J Kushner, CCIM

  • Contact me for a FREE Lease Review!
  • This field is for validation purposes and should be left unchanged.

Categories

  • About Us
  • Blog
  • CCIM
  • Commercial Real Estate
  • Community
  • Construction
  • CPBJ Articles
  • CREDC Articles
  • Feature
  • Featured Opportunities
  • Guest Blogger
  • Healthcare
  • In the News
  • Industrial
  • Local Market
  • Office Leasing
  • Retail
  • Success Stories
  • Tenant Representative/Buyer Agent
  • Trends

(c) 2019 OMNI REALTY GROUP- Website Design by The John Webster Company