OMNI Realty Group
  • Email
  • Facebook
  • Linkedin
  • Twitter
  • Rss
  • Home
  • Omni Advantage
    • Success Stories
    • Our Clients
    • Completed Deals
    • In the News
  • Services
  • Resources
    • Market Reports
    • Local Market
    • Office Space Calculator
    • CCIM Advantage
      • User Investment
      • CCIM Brochure
      • Total Expertise
      • Distinguish Yourself
      • How Would You Rate
  • Global Reach
  • Property Search
  • FAQ
  • Blog
  • Contact Us

Posts tagged "statistics"

Home» Posts tagged "statistics"

Census Data: National and Local Trends You Need to Watch

Posted on June 3, 2019 by Mike Kushner in Blog, Commercial Real Estate, CPBJ Articles, Local Market, Trends No Comments

Note: This article was published by the Central Penn Business Journal. Click here to read the original version.


Census data provides a fascinating look into population growth trends that stand to have a profound impact on our economy, both locally and nationally. More than just being “interesting” data to study, population growth and decline points us to important trends that will reshape supply and demand in various industries, one of the most prominent being real estate.

Just last month, the US Census Bureau released new population estimates. These estimates account for and compare the resident population for counties between the dates of April 1, 2010 to July 1, 2018. The outcome? There are shifts in population taking place across the nation that may differ from what you might assume. Let’s take a look at some of the highlights from this data from a national and local level.

At a National Level

South and West Lead Population Growth

The census data confirmed that counties with the largest numeric growth are located in the south and the west regions. In fact, Texas claimed four out of the top 10 spots. Looking at population growth by metropolitan area, Dallas-Fort Worth-Arlington, Texas, had the largest numeric growth with a gain of 131,767 people, or 1.8 percent taking place in 2018. Second was Phoenix-Mesa-Scottsdale, Arizona which had an increase of 96,268 people, or 2.0 percent. The cause of growth in these areas is the result of migration, both domestic and international, as well as natural increase. In Dallas, it was natural increase which served as the largest source of population growth, whereas in Phoenix I was migration.

Fastest Growth Occurred Outside of Metropolitan Areas

Surprisingly, no new metro areas moved into the top 10 largest areas. Of the 390 metro areas within the US (including the District of Columbia and Puerto Rico), 102 of these areas, or 26.2 percent experienced population decline in 2018. The five fastest-decreasing metro areas (excluding PR) were Charleston, West Virginia (-1.6 percent); Pine Bluff, Arkansas. (-1.5 percent); Farmington, New Mexico (-1.5 percent); Danville, Illinois (-1.2 percent); and Watertown-Fort Drum, New York (-1.2 percent). The population decreases were primarily due to negative net domestic migration.

North Dakota Claims Fastest Growing County

Among counties with a population of 20,000 or more, Williams County, North Dakota claimed the top spot as the fastest-growing county by percentage. This county increased by 5.9 percent between 2017 and 2018 (from 33,395 to 35,350 people). The rapid growth Williams County experienced was due mainly to net domestic migration, 1,471 people, in 2018. The county also experienced growth between 2017 and 2018 by both natural increase of 427 people, and international migration of 52 people.

More Growth than Decline

Out of 3,142 counties, 1,739 (or 55.3 percent) gained population between 2017 and 2018. Twelve counties (0.4 percent) experienced no change in population, and the remaining 1,391 (or 44.3 percent) lost population. Between 2010 and 2018, a total of 1,481 (or 47.1 percent) counties gained population and 1,661 (or 52.9 percent) lost population. Though there has been more growth than decline overall, the numbers indicate that this can easily shift year over year.

At a Local Level

Dauphin County

 Lancaster County

York County

Cumberland County

Cumberland, Dauphin, Lancaster and York Experience Consistent Growth

The most notable trend to take place between 2010 and 2018 in Central PA is that these counties all experienced consistent growth year-over-year. Moreover the growth occurred fairly evenly over the last 8 years. This provides consistency and enables the economy to respond to the growth over a reasonable amount of time.

Counties Also Maintain Same Order of Ranking in Population

Another trend worth noting is that the counties have maintained the same order of ranking based upon population for 8+ years. For example, in 2010 these counties in order of smallest population to largest population was Cumberland, Dauphin, York, Lancaster. This is the same ranking we see in 2018, and every year in between. No county surpassed another at any point.

Lancaster Remains Largest and Fastest Growing County

Lancaster County has a major lead in population over the others. At 984 square miles, it is also the largest of the 4 counties. Between 2010 and 2018 it also experienced the largest numeric growth at 24,112 people. Number two in numeric growth was actually the smallest of the four counties, Cumberland County, which grew by 16,017 people. York County grew by 13,301 people and Dauphin County grew by 8,997 people.

Overall, the latest US Census offers valuable and insightful information related to population growth between 2010 and 2018. Understanding the cause of either growth or decline provides framework for how these shifts may continue on their course, or change in the future.

A deeper dive into the census data reveals several demographic changes impacting commercial real estate development: household formations, aging baby boomers, growing millennials, women in the workforce, and migration toward the South.

Today’s demographic changes present challenges for commercial real estate developers, but they also offer lucrative opportunities to firms creatively adapting to new demands.

[Online Resources] Real Estate, 2018, america, analysis, blog, blogger, camp hill, carlisle, census, census bureau, central pa, central penn business journal, change, Commercial Real Estate, cumberland, data, dauphin, decline, facts, growth, harrisburg, hershey, homes, hummelstown, increase, information, lancaster, lemoyne, local, local market, migration, Mike Kushner, nation, national, pennsylvania, population, real estate agent, real estate broker, residential, statistics, trends, united states, york

Jobs – Not Economy – Drive Commercial Real Estate Activity

Posted on August 22, 2018 by Mike Kushner in Blog, CPBJ Articles, Trends No Comments

Note: This article was published by the Central Penn Business Journal. Click here to read the original version.


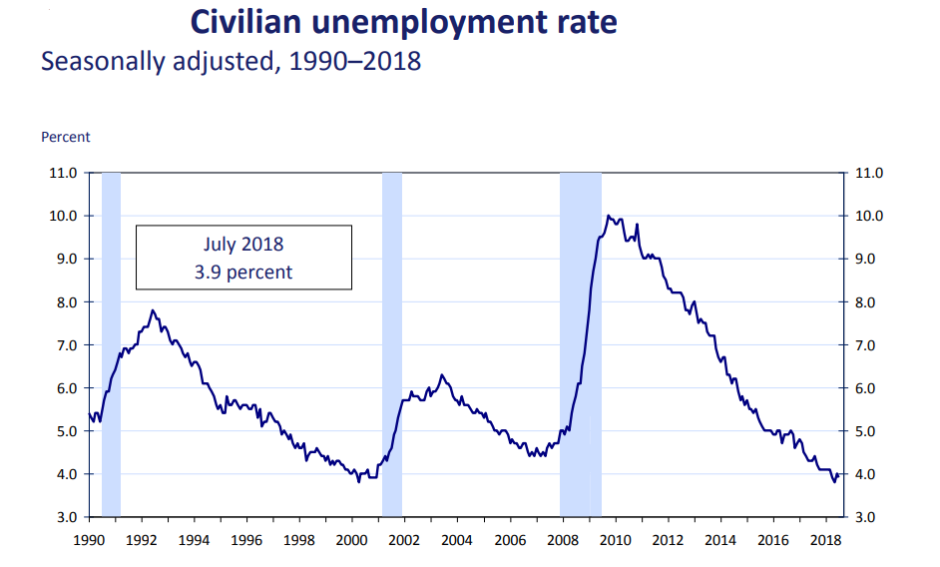
Earlier this month, it was reported that the number of Americans filing for unemployment benefits rose less than expected. To put this into perspective, claims dropped to 208,000 during the week of July 14, which was the lowest it has been since December 1969! After peaking at nearly 300,000 claims in October of 2017, we have seen a mostly steady (with some variation) decline in unemployment claims moving forward.

Dropping unemployment numbers indicate a strong labor market. The United States has an estimated 149 million jobs – 19 million more than it did just nine years ago. When you think about that type of job growth, it’s easy to see how it will have an impact on commercial real estate. To accommodate 19 million more workers, businesses have had to add space. Even for jobs that are run outside of traditional office space, there are still many more that do utilize office, retail or industrial real estate to some capacity.

Source: Bureau of Labor Statistics

Many people may assume that it’s the economy that drives commercial real estate activity, but really it’s jobs. The two are closely correlated, but for several compelling reasons jobs have the greater impact and drive businesses to either expand or contract their commercial space.

It all comes down to people and space.

Economic growth is measured by GDP and can be fueled by any number of factors, most of which won’t have a direct impact on commercial real estate. Businesses can earn more money without necessarily needing to hire more people or move into a different commercial location. Though it’s common that when the economy is growing, the commercial real estate industry becomes more active, the true driving force is jobs.

When businesses need more people, they also need more space to accommodate these people. A business using traditional office space is not likely able to hire more than three or so people before working quarters begin to feel a bit crammed. As a result, they move. It is increasing jobs, not just economy, that spurs new commercial real estate activity.

Change doesn’t happen overnight.

There is somewhat of a long tail on job growth driving commercial real estate activity. It takes time to catch up! When businesses are adding employees, they will usually make their current space “work” for as long as possible and then strategically move into a bigger space when they absolutely must. Conversely, when businesses are forced to lay off employees, they often stay in their current space, even if it means some space goes unused. The reason is it’s easier (and less expensive) to lay off employees as the first means of cutting costs than it is to downsize commercial space.

So, the job growth that we’ve seen over the course of many years is now driving the commercial real estate activity we are seeing today.

Slowing, but not stopping.

Job growth peaked in early 2015, then fell steadily through the end of 2017. Since then we have seen a modest, yet mostly steady increase in recent months. The reality is job growth, at any rate, cannot go on forever. The reason is, at some point, the United States will reach its “full employment” where everyone who wants a job, has a job. The unemployment rate, now at 4%, is about as low as it has been since the late 1960s, almost 50 years ago.

For commercial real estate, the link between job growth and space demand is clear and direct, though there may be lags. There will always be businesses who are looking to change their commercial space. Some will want more space, some will want less. Others will want to move to a newer space or will desire a different location. Businesses will close while others open. And so the cycle continues.

Short-Term Impact

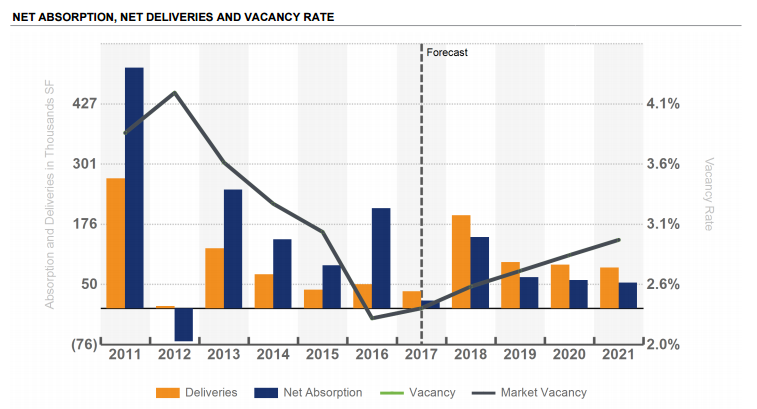
Even with economic growth heating up, commercial real estate investors and property owners should not set their expectations for greater space absorption too high, at least in the short-term. Yes, there will be some pick-up in leasing associated with the spike in GDP growth. However, CRE professionals would be wise to focus more on job growth as the gauge for leasing prospects – and this outlook looks much more moderate because the ranks of unemployed workers available is largely exhausted. Looking at the short-term, we should not anticipate significant growth in property leasing this year. The surging industrial sector is the exception, which is the result of the shift from in-store to online shopping, not jobs.

Do you agree that it’s jobs, not the economy, that has the greater impact on commercial real estate activity? Why or why not? Join in the conversation by leaving a comment below.

[Online Resources] Real Estate, advice, blog, central penn business journal, Commercial Real Estate, cpbj, decline, Economy, effect, employment, expert, growth, impact, jason scott, job, jobs, labor, long-term, Mike Kushner, Omni Realty, opinion, rate, short-term, statistics, trends, unemployment

10 Facts Any Commercial Real Estate Investor Should Know about Central PA’s Industrial Market

Posted on April 30, 2018 by Mike Kushner in Blog, Commercial Real Estate, Industrial, Local Market No Comments

10 Facts Any Commercial Real Estate Investor Should Know about Central PA’s Industrial Market

Central PA’s industrial real estate market is unique for a variety of different reasons. Taking into consideration its geographic, demographic and economic factors, we’ve compiled a list of what we feel are the most important facts worth knowing about our local industrial market.

If you are a commercial real estate investor, or simply someone who wants to know more about Central Pennsylvania’s commercial real estate market, you are sure to find this list of top 10 facts both valuable and interesting. Let’s take a look!

  1. Harrisburg-York-Lebanon CSA is 3rd most populous in PA and 43rd most populous in U.S.

The Harrisburg-York-Lebanon Combined Statistical Area (CSA) is made up of six counties and includes four metropolitan areas in Central Pennsylvania. In 2010, the CSA’s population was 1,233,708 people, making it the 3rd most populous CSA in PA and the 43rd most populous CSA in the U.S. The Harrisburg-York-Lebanon CSA includes the following Metropolitan Statistical Areas (MSAs): Harrisburg-Carlisle, Lebanon, Gettysburg and York-Hanover.

  1. Harrisburg area puts up strong competition against Lehigh Valley.

Though Lehigh Valley is commonly recognized as Pennsylvania’s leader in warehousing and distribution, Harrisburg delivered only 600,000 SF less than Allentown in 2017, while also generating roughly the same rent growth. Additionally, companies such as Whirlpool, Amazon, Ace Hardware, FedEx, Kohler, and Lindt Chocolates have set up large-scale warehouse and distribution centers in Harrisburg – and those tenants account for just a portion of more than 16 million SF of net absorption.

  1. Harrisburg-Carlisle and Lancaster Ranked Among Leaders in National Job Growth

Of the 25 metro areas with the fastest job growth, as of August 2017, both Harrisburg-Carlisle and Lancaster placed on this competitive list. Lancaster ranked number 24 for its steady growth as it diversifies its economy and renovates its downtown and industrial areas. In six months Lancaster added 3,100 new jobs, bringing its total employment to 252,400 and 2017 growth rate to 1.23%. Harrisburg-Carlisle ranked number 8 on the list with 6,200 new jobs added in the first two quarters of 2017, bringing total employment to 346,100 and 2017 growth rate to 1.82%. Noted was the area’s diverse group of healthcare, technology and biotechnology businesses.

  1. Prime location for warehousing and distribution.

Central Pennsylvania is a premiere market for industrial space for several compelling reasons. For businesses who need easy and affordability storing and shipping of products, the areas offers a great roadway system, an abundant work force, relatively inexpensive and available raw land, and the ability to reach 70 to 80 percent of the U.S. population in 24 hours. Additionally, our government regulations on warehousing and distribution are comparatively easy and straightforward compared to other nearby states or regions.

  1. Four of the 10 Select Top Industrial Leases in Q4 2017 took place in the Harrisburg market.

According to CoStar’s Q4 report for 2017, Harrisburg east and west markets represented the majority of top industrial leases signed that year. Prologis Carlisle (1,029,600 SF), Goodman Logistics Center Carlisle (1,007,868 SF), Prologis Harrisburg (623,143 SF) and Carlisle Distribution Center (575,000 SF) were all leased to different businesses who were looking to grow their industrial real estate space in Central Pennsylvania. This activity indicates economic growth and interest in Central PA’s industrial real estate market, both from businesses and real estate investors.

  1. Lancaster market has the highest quoted rental rate for industrial space in Central PA at $4.69 per SF.

Even though Lancaster’s quoted rental rate for industrial space decreased by $0.45 per SF than where it was at the end of Q4 2016, it still comes in higher than Central PA’s other surrounding submarkets. At $4.69 per SF, Lancaster is $1.41 per SF higher than Lebanon, $0.03 per SF higher than Harrisburg/Carlisle, $0.08 per SF higher than Gettysburg and $0.67 per SF higher than York/Hanover based on Q4 2017.

  1. Lancaster also has the lowest vacancy rate for industrial space in Central PA at just 2.0%.

Lancaster ended Q4 2017 with the lowest vacancy rate of all surrounding submarkets. Compared to Lancaster’s vacancy rate of 2.0%, Lebanon came in at 15.8%, Harrisburg/Carlisle at 6.8% and York/Hanover at 4.9% based on Q4 2017. Though Gettysburg did end 2017 with a vacancy rate of 0.4%, it’s important to note this submarket has just 78 buildings with a combined 4,372,179 SF of existing inventory which places it at a much different level than the other submarkets, comparatively.

  1. Within the MSA, Harrisburg/Carlisle has the largest SF of industrial space under construction at 1,813,468 SF.

Two significantly large industrial projects will soon result in the addition of 1,813,468 SF to the Harrisburg/Carlisle submarket. Comparatively, Lebanon has three buildings under construction with a combined 1,310,195 SF of space, Lancaster has two buildings under construction with a combined 76,486 SF of space, York/Hanover has two buildings under construction with a combined 895,000 SF of space and Gettysburg has no new industrial space under construction. For Central PA as a whole, that equals 4,095,149 SF of new industrial space that will soon be delivered to the market.

  1. Harrisburg/Carlisle’s ended 2017 with a positive net absorption of 2,700,108 SF.

According to CoStar’s Q4 2017 industrial market report, Harrisburg/Carlisle ended the year with the highest, positive net absorption we’ve seen since prior to 2014. At 2,700,180 SF, this is significantly higher than any other quarter that year, especially Q2 where the net absorption dropped to negative 499,576 SF. Additionally is Q4 2017, one new building was delivered to the market, adding 1,100,000 SF of space. Even with this influx of inventory, the net absorption rose by 2,083,756 SF. The new building that was delivered is Whirlpool’s new distribution facility located at 100 Fry Drive, Mechanicsburg.

  1. Influx of State and Federal dollars will continue to improve transportation in and around Central PA.

The Trump administration has recently been touting a $1.5 trillion, 10-year public-private plan to improve roads, bridges, ports and other infrastructures across the nation. Central Pennsylvania has plans to utilize some of this federal funding to bolster its priority projects which include fixing structurally deficient bridges and widening interstates. Improvement to our roadways and infrastructure will improve public safety, create construction jobs and make Central PA an even more attractive location for warehousing and distribution.

After reading through these top 10 facts any commercial real estate investor should know about Central PA’s industrial market, you are likely to have some comments or questions of your own.

Start a discussion by leaving a comment below!


[Online Resources] Real Estate, camp hill, carlisle, central pa, central pennsylvania, commercial, Commercial Real Estate, costar, CRE, data, distribution, harrisburg, hershey, hummelstown, industrial, information, investment, investor, lemoyne, list, mechanicsburg, Mike Kushner, msa, Omni Realty, pennsylvania, research, statistics, top 10, trends, trucking, warehouse

17 New Retail Buildings Under Construction in Central PA

Posted on September 18, 2017 by Mike Kushner in Blog, Local Market, Trends No Comments

Cost of retail space in Central Pennsylvania continues to climb despite negative absorption and rising vacancy.

If you’ve been paying attention you know that traditional retail space is undergoing a major shift in how and where it’s being used. Many stores have closed their doors and/or have embraced the growth of ecommerce over brick-and-mortar locations.

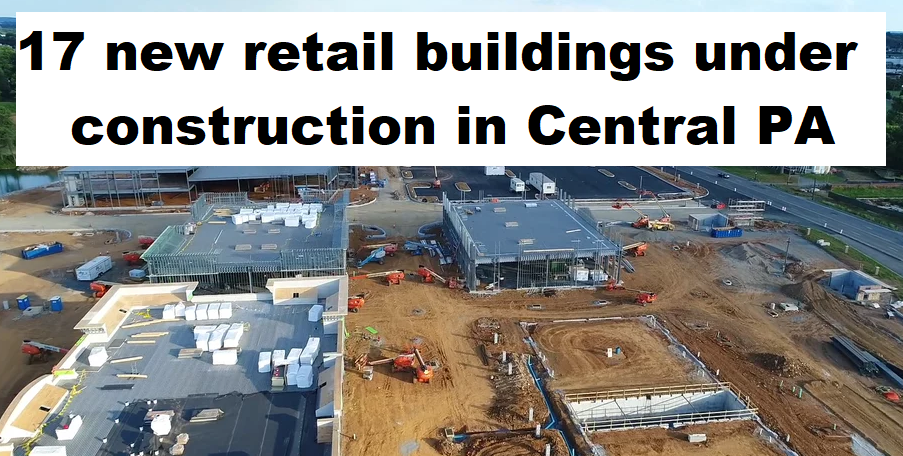
In Central Pennsylvania, we’re seeing quite a few interesting trends that indicate more change is yet to come. Net absorption plummets further into the negative with just 3 new buildings delivered this quarter. A total of 17 new buildings are under construction which begs the question of how the market will respond when 423,994 square-feet of new space is delivered in the coming months. Though vacancy rate is on the rise, so is the quoted rental rate.

How do these trends tie together and what do they tell us about the future of retail real estate in Central Pennsylvania? Let’s take a closer look.

SELECT TOP UNDER CONSTRUCTION PROPERTIES

Coming in at number five on CoStar’s list of Select Top Under Construction Properties is the Gateway Hanover Shopping Center on Wilson Avenue in Hanover. The 136,193 square-foot Target is expected to be completed in Q3 2017. Number seven on the list is the Crossings at Conestoga Creek in Lancaster. This mixed-use project, anchored by Wegmans, will deliver 90,000 square-feet of unleased retail space in Q4 2018. Coming in at number 14 on the list is the Shoppes on South Queen located at 1701 S. Queen Street in York. The 55,000 square-feet of space, which will be delivered in Q4 2017, is 53% preleased.

SELECT TOP LEASES

Among CoStar’s list of Select Top Leases for Q2, one Central Pennsylvania lease made it to the top 10. Red Rose Commons in Lancaster County leased 43,091 square-feet of retail space to Burlington Coat Factory.

ABSORPTION

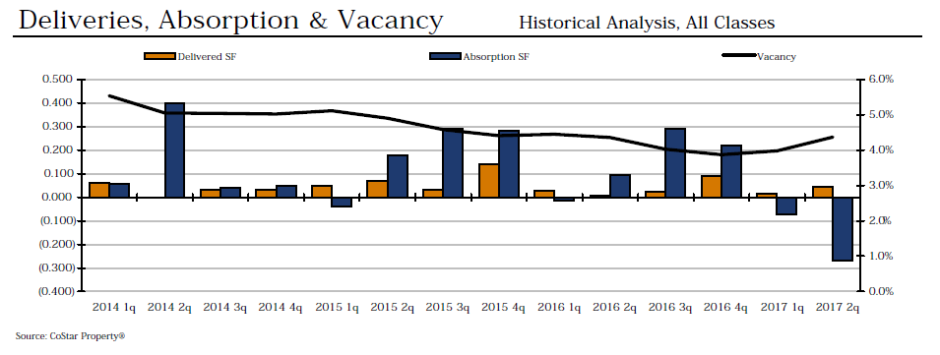
Net absorption, which was already in the red from Q1, fell even lower this quarter to negative 268,916 square-feet. This is the greatest square footage of space to be negatively absorbed in any one quarter since Q3 2013. It is also only the fourth time the market has experienced a negative net absorption in four years. Three new retail buildings were delivered this quarter totaling just 43,825 square-feet; however, 17 additional building are under construction with a total of 423,994 square-feet of new space that will be dumped into the market in the coming months.

VACANCY & RENTAL RATES

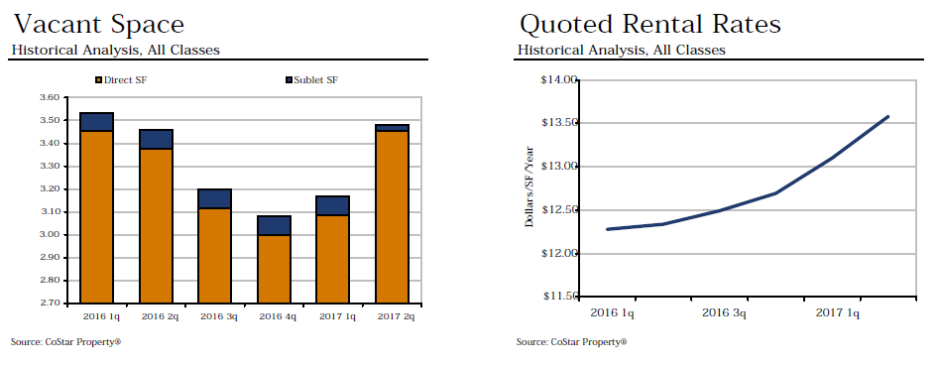
Vacancy rates raised ever so slightly this quarter, from 4.0% to 4.4%. Even with a negative net absorption and increasing vacancy rates, the quoted rental rate rose in Q2 from $13.10 to $13.58 per square foot. This is a recent record high for vacancy rates that have been almost consistently decreasing since 2013.

What we can learn from the market’s performance in Q2 is that, while retail space nationwide has taken a major blow over the last few years, it’s still in demand. The shift toward ecommerce has changed the landscape of retail real estate, but it has not made it completely irrelevant. New buildings are under construction, retailers are moving into new space and the rising cost per square foot demonstrates the demand exists.

Over the coming months and years, it will be important to watch how retailers strategically place their brick-and-mortar locations and how they rebuild their business model to harness the popularity of ecommerce. The business that will thrive in this new landscape will be ones who embrace change and listen to consumer demand.

What trend in Central Pennsylvania’s retail market do you think will have the largest impact? Share your insight and join in the conversation by leaving a comment below!

Learn more from past market reports:

Amidst Massive Retail Closings, Central PA Commercial Real Estate Continues to Grow

Central PA Experiences Highest Number of Retail Store Closings Since Recession

6 Things Disrupting Commercial Real Estate in 2017


[Online Resources] Real Estate, absorption, blog, central pennsylvania, Commercial Real Estate, costar, CRE, facts, harrisburg, lancaster, market report, Mike Kushner, mixed use, Omni Realty Group, pennsylvania, q2, rental rates, retail, retail real estate, retail space, statistics, stores, top leases, top sales, trends, under construction, vacancy, york

Central Pennsylvania Office Real Estate Report for Q2 2017

Posted on August 14, 2017 by Mike Kushner in Blog, Commercial Real Estate, Local Market, Trends No Comments

Decrease in vacancy and recent record high for rental rates indicate a healthy demand for Central Pennsylvania Office Space.

Central Pennsylvania’s office real estate market should have very few concerns or complaints based upon its performance in Q2 2017. Three new office spaces were delivered this quarter, all of which are 100% preleased. As a result, net absorption continued to rise into the black by more than 50,000 square feet. Vacancy declined as did vacant square footage. Most noteworthy, the quoted rental rate jumped by $0.10 per square foot, making this quarter the highest quoted rental rate the market has seen since prior to Q3 2013!

In addition to these highlights, there is a lot more we can take away from the local office real estate market’s performance this last quarter. Here are the major actions that have taken place in Central Pennsylvania according to CoStar’s Q2 Office Statistics.

SELECT YEAR-TO-DATE DELIVERIES

Three new office spaces entered the market in Q2 2017 and they all made it to CoStar’s Select Top Year-to-Date Deliveries. The largest of the three is at 100 Millport Road in Lancaster. The 93,000 square-feet of B Class office space is 100% prelease. Next on the list for Central PA’s Q2 deliveries is the Goodville Mutual Expansion located in Lancaster. Goodville Mutual Casualty Company added on an additional 20,000 square-feet of Class B office space that is 100% prelease.  Last but not least is the 13,000 square-foot Class B office space located at 40 Old Willow Mill Road in Mechanicsburg that is 100% preleased to Penn State Medical Group.

SELECT TOP LEASES

Of the Select Top Leases featured in the Q2 CoStar Office Market Report, just one lease from the Central Pennsylvania submarket made the list, but it did so at number 5. A large healthcare company, Centene leased the office space at 300 Corporate Center Drive, Harrisburg from Cushman & Wakefeld. The total space of the lease is 68,846 square-feet.

ABSORPTION

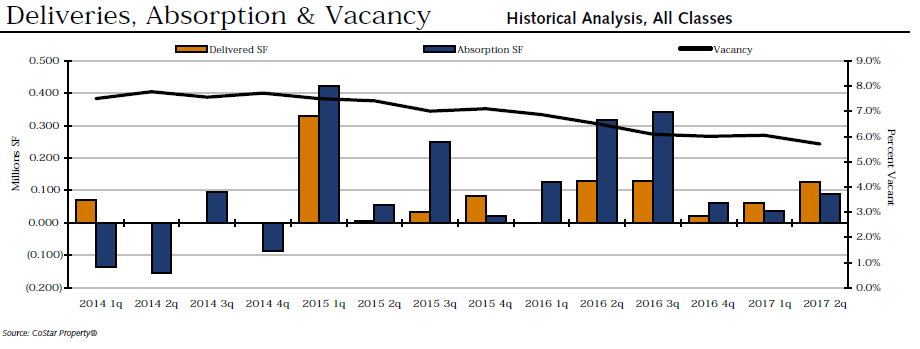
Net absorption is back on the rise, after taking a hit last quarter. In Q2 it was just 35,817 square-feet; now it is 88,814 square-feet. Though there is a long way to go to reach the recent record high of 421,430 square-feet that we saw in the beginning of 2015, we are at least headed back in the right direction. Considering three new buildings entered the market this month with a combined 126,000 square-feet of space, it’s a good indicator of market demand that net absorption rose.

OVERALL VACANCY & RENTAL RATES (ALL CLASSES)

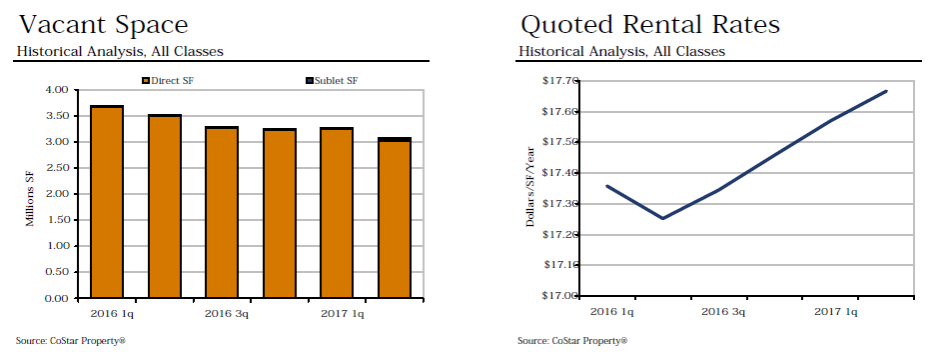
This quarter, the market experienced a decrease in vacancy from 6.0% last quarter to 5.7% currently. This correlates with the decrease in vacant square-footage, down from last quarter’s 3,273,675 square-feet to 3,080,214 square-feet currently. Most noteworthy, the quoted rental rate has risen significantly, $0.10 per square foot in just one quarter. It now stands at $17.67 per square foot which is higher than it’s been since prior to Q3 2013. With only one building under construction, new space will not be entering the market anytime soon, forcing businesses to continue to use up existing inventory.

CLASS A TRENDS

Specifically looking at class A office space, vacancy is at 8.2% and the quoted rental rate is $20.80 per square-foot. The year-to-date net absorption is 20,217 square-feet, with 60,000 square-feet in year-to-date deliveries and 40,000 square-feet currently under construction.

CLASS B TRENDS

Specifically looking at class B office space, vacancy is at 5.5% and the quoted rental rate is $17.36 per square-foot. The year-to-date net absorption is 235,677 square-feet, with 126,000 square-feet in year-to-date deliveries. No new buildings are currently under construction.

CLASS C TRENDS

Specifically looking at class C office space, vacancy is at 4.7% and the quoted rental rate is $15.79 per square-foot. The year-to-date net absorption is negative 131,263 square-feet. This is a major drop compared to the other classes and the overall net absorption for the Central PA submarket as a whole. There are zero year-to-date deliveries and zero projects under construction for class C space.

What trend from the second quarter did you find most interesting or impactful to Central Pennsylvania’s office market? Share your opinion by leaving a comment!

Learn more from past market reports:

Central Pennsylvania Industrial Real Estate Report for Q2 2017

Central Pennsylvania Industrial Real Estate Report for Q1 2017

Central PA’s Office Real Estate Market Hangs on to Low Vacancy, Slows Down on Net Absorption

[Online Resources] Real Estate, 2017, buyers agent, carlisle, central pennsylvania, Commercial Real Estate, costar, harrisburg, hershey, lancaster, lease, lemoyne, market, mechanicsburg, Mike Kushner, new cumberland, office, Omni Realty Group, q2, real estate agent, real estate broker, rent, report, second quarter, space, statistics, tenant representative, trends, york

Central Pennsylvania Industrial Real Estate Report for Q2 2017

Posted on July 17, 2017 by Mike Kushner in Blog, Local Market, Trends No Comments

Net absorption falls by 3.5 million square-feet with more space to come!

In the first quarter of 2017, the Central Pennsylvania industrial real estate market* gained more than two million square-feet of new space. Now into the second quarter, the rate at which we’re adding new space has slowed, but the market is still trying to absorb what was dumped into it earlier this year. As a result, net absorption fell into the negatives, decreasing by more than 3.5 million square-feet from last quarter. The vacancy rate also rose by more than a whole percentage point. Most interestingly, the quoted rental rate actually rose by a penny, placing it back near the recent record high we saw at the end of 2016.

How does this all tie together and what does it mean for the future of Central Pennsylvania’s industrial real estate market? Take a look!

SELECT YEAR-TO-DATE DELIVERIES

As far as new deliveries, Q2 slowed considerably from what we experienced in Q1. Within the first quarter of 2017, Central Pennsylvania received five new industrial properties, totaling a combined 2,244,371 square-feet of space. Now in the second quarter, just three new buildings were completed and added a total of 1349,697 square-feet to the market. Two of these buildings ranked among CoStar’s top 15 select-year-to-date deliveries. Goodman Logistics Center, Building 2 in Carlisle was completed this quarter, adding 938,828 square-feet of unleased space to the market. The other building, located at 53 Commerce Drive in Mechanicsburg, delivered 340,869 square-feet of space, which is 40% occupied.

SELECT TOP UNDER CONSTRUCTION PROPERTIES

Looking forward, Central Pennsylvania stands to gain a considerable amount of new industrial space in the coming year. Five properties are under construction and are set to be delivered later this year and into 2018. The largest is located at 100 Fry Drive in Mechanicsburg with 1.1 million square-feet of fully preleased space that will be completed next quarter. The second largest is Orchard Business Park II, Building A, in York with 780,000 square-feet of unleased space that will be completed in the fourth quarter of 2017. Additionally, the former Quaker Oats manufacturing and distribution facility, located at 485 St. Johns Church Road in Hampden Township, is being renovated into a smaller, modern warehouse facility. The renovation and expansion work will be done by April 2018, and the new warehouse section will be done by next July.

SELECT TOP SALES

Within the last two months, three buildings in Carlisle have sold, totaling an exchange of 2,222,121 square-feet of industrial space. The largest is the Ames True Temper Building with 1,226,525 square-feet which sold for $90,150,000 to Clarion Partners. Located at 1 Ames Drive in Carlisle is 595,000 square-feet of industrial space that sold to UPS for $55 million. Finally, at 100 Louis Parkway, 400,596 square-feet of space sold to Industrial Property Trust for $28,850,000.

ABSORPTION

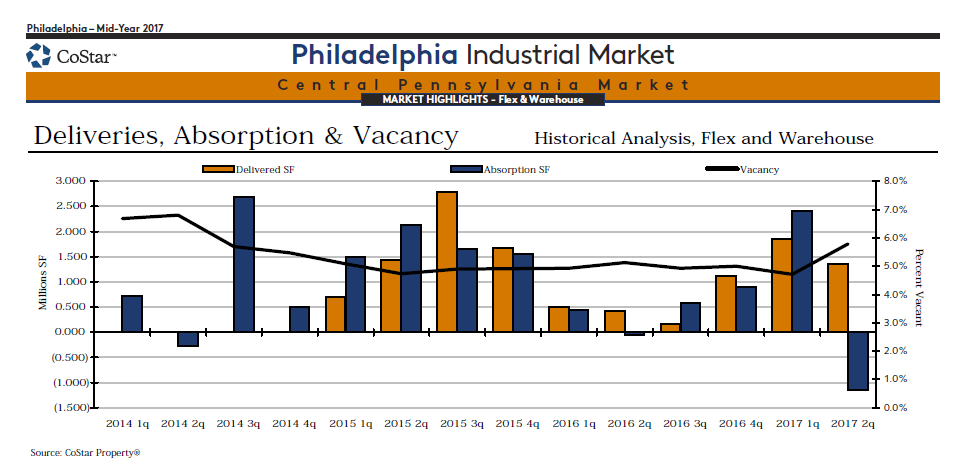
Net absorption fell significantly this quarter, plummeting to a negative 1,1446,892 square-feet. This is a large drop from the positive net absorption of 2,402,682 square-feet we saw just last quarter. This is the lowest net absorption has been since prior to 2013. With five buildings delivered last quarter, three delivered this quarter, and five more under construction, the rise or fall of future net absorption will be mostly determined by the ability to lease out all of this new space.

VACANCY & RENTAL RATES

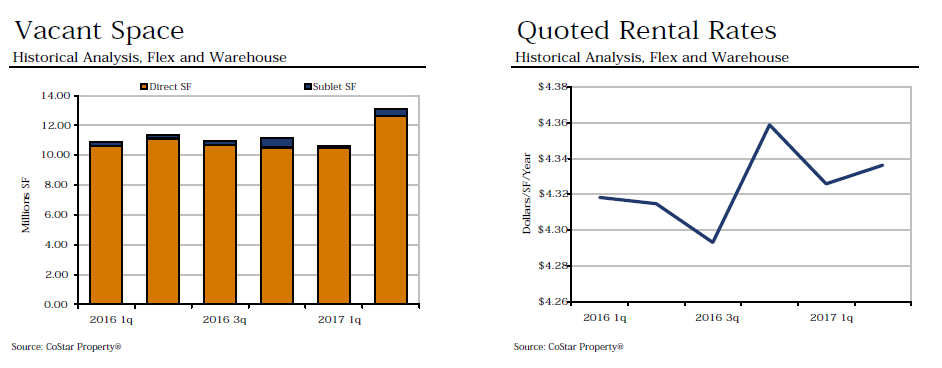
As you might expect, based upon other trends, Central Pennsylvania’s vacancy rate for industrial space rose from 4.7% last quarter to 5.8% this quarter. Vacant space also rose by more than 3 million square-feet. Even with negative net absorption and an increase in vacancy rate, the quoted rental rate rose ever so slightly. It is now $4.34, nearly back to the recent record high we experienced at the end of 2016 when it reached $4.36. It will be interesting to watch how the market reacts to the recent influx of new space, further impacting the vacancy and rental rates for Q3 and beyond.

What trend from the second quarter did you find most interesting or impactful to Central Pennsylvania industrial space? Share your insights by leaving a comment below.

*For the purposes of this article, the Central Pennsylvania market is defined as Dauphin, Cumberland, York, Lancaster and Adams Counties.

Learn more from past market reports:

Central Pennsylvania Industrial Real Estate Report for Q1 2017

Amidst Massive Retail Closings, Central PA Commercial Real Estate Continues to Grow

Central PA’s Office Real Estate Market Hangs on to Low Vacancy, Slows Down on Net Absorption

analysis, central pa, central pennsylvania, Commercial Real Estate, data, dillsburg, harrisburg, hershey, industrial, lancaster, lemoyne, market, mechanicsburg, Mike Kushner, new cumberland, news, pennsylvania, report, statistics, trends, warehouse, york

Amidst Massive Retail Closings, Central PA Commercial Real Estate Continues to Grow

Posted on June 26, 2017 by Mike Kushner in Blog, Local Market, Trends No Comments

We’ve watched it on the news, read about it in the papers and have seen it in person. Several large retailers in Central Pennsylvania have made the decision to close their doors, such as Sears, Kmart, and hh gregg, as well as a growing list of other retailers struggling to stay in the black.

The landscape of retail real estate is changing, and with that the market is reacting. While some retailers are looking to move out of brick-and-mortar locations, other mega brands like Amazon are looking to move in. What does this mean for the future of retail real estate, specifically here in Harrisburg, York and Lancaster? Let’s take a look at changes that have taken place and trends that have emerged over the last 12 months.

Harrisburg

The Harrisburg retail market has gained 162,000 square-feet of new space in the last 12 months. However, in this same amount of time, the market was only able to absorb 110,000 square-feet, causing the total net absorption for the quarter to drop to a negative 153,000 square-feet. The 4.2% vacancy rate is an increase from the recent low we saw in Q1 2017, when it dipped down to 3.7%. Though the market has 0.0% rent growth, there has been $82M in sales that is almost double the historical average of $52M. Harrisburg has just 1 under-construction retail property that will be delivered in 2017 and will add 12,000 square-feet of unleased space to the market. Though we have recently seen quite a few closings of retail locations, there remains more than 20 proposed projects for new retail space including general retail, community centers and strip malls.

York

The York retail market has gained 27,000 square-feet of new retail space over the last year, with a 12-month net absorption of 152,000 square-feet. The total net absorption for the current quarter is negative 10,000 square-feet. York’s vacancy rate is a bit higher than Harrisburg’s at 5.7%, but over the past 12 months, it has decreased by 0.6%. The market experienced a very small rent growth of 0.1% and did $19M in sales in 12 months’ time. York County has 4 under-construction retail properties that will be delivered in 2017-2018 and will add 264,217 square-feet of mostly unleased space to the market.

Lancaster

In Lancaster County, 34,000 square-feet of new retail space was delivered to the market in the last 12 months. The 12-month net absorption is 169,000 square-feet and the total net absorption for the current quarter is negative 13,000 square-feet. Lancaster’s vacancy rate is much lower than York and Harrisburg, coming in at 2.4%. In the last 12 months the vacancy rate has decreased by 0.6%, reaching its lowest point back in Q4 2016 when it was 2.3%. Like Harrisburg, Lancaster did not experience a rent growth in the last 12 months, but did do $39M in sales. Lancaster County has 5 under-construction retail properties that will be delivered in 2017-2018 and will add 159,500 square-feet of space to the market, more than half of which is preleased.

Trends & Overview

In the current market, each city has its strengths and weaknesses. Harrisburg has the highest 12-month sales of the three, but the lowest net absorption for the current quarter. Lancaster has the lowest vacancy rate of the three, but has relatively unimpressive new construction projects, sales and rental growth. York has the most new retail space scheduled to be delivered in the next few years, but has the lowest 12-month sales of the three.

All things considered, each market appears to be stable and poised for additional growth. Vacancy rates have remained mostly the same or experienced a decrease, the markets are demonstrating their ability to absorb most of the new space that is being delivered, and there continues to be under-construction projects and plan for new space. These indicators provide us with confidence that real estate investors, developers and retailers continue to see value in doing business in Central Pennsylvania.

Between Harrisburg, York and Lancaster, the area offers some unique benefits including more space and at a lower cost compared to big cities. We are also a main corridor for commuters and travelers going to New York, Philadelphia, Baltimore and Washington, D.C. Simply put, Central Pennsylvania has the right combination of resources and advantages to remain a vibrant location for retail growth.

Do you agree? What Central PA market is having the best year so far? Share your thoughts by commenting below!

central pa, Commercial Real Estate, Construction, costar, Economy, expert, growth, Mike Kushner, new, Omni Realty, pennsylvania, rental rate, report, retail, space, statistics, trends, vacancy

Central Pennsylvania Industrial Real Estate Report for Q1 2017

Posted on April 20, 2017 by Mike Kushner in Blog, Commercial Real Estate, Local Market, Trends No Comments

Region gains more than two million square feet of new industrial space in first quarter

2017 is on track to becoming one of the best years yet for industrial real estate in Central Pennsylvania – and we’ve only just wrapped up the first quarter! The market absorbed more than 2 million square feet of new space, while increasing net absorption and holding on to the highest rental rate per square foot that we’ve had in over four years. The vacancy rate also holds steady at 5.5%, even with an increase in vacant space.

The market almost can’t get its hands on space fast enough. Five of the six buildings delivered this quarter made it to CoStar’s Top 10 list. Additionally, nine new buildings are under construction and will deliver yet another 4,410,916 square feet of new space.

To see the full impact of the growth taking place in Central Pennsylvania’s industrial real estate market, take a look at the highlights from Q1 2017.

SELECT YEAR-TO-DATE DELIVERIES

Within the first quarter of 2017, Central Pennsylvania received six new industrial properties, totaling a combined 2,244,371 square feet of space. Five of these made it to CoStar’s list of Select Year-to-Date Deliveries. The first and largest is the Eden Road Logistics Center in York with 754,881 square feet of space. Next, Carlisle Distribution Center – Building 5 delivered 582,000 square feet of space. The Crossroads Logistics Center in Jonestown delivered 398,250 square feet of space. The property at 51 Commerce Drive – Building 1 in Reading delivered 339,200 square feet of space. And the property at 1451 Stoneridge Drive in Middletown contributed an additional 10,200 square feet of space.

SELECT TOP UNDER CONSTRUCTION PROPERTIES

If six new properties delivering in the Q1 wasn’t enough to prove the rapid growth of industrial real estate in Central Pennsylvania, there are yet nine more properties under construction, four of which made it to CoStar’s list of Select Top Under Construction Properties. A 1.1 million square-foot property located at 100 Fry Drive, Mechanicsburg is expected to deliver in Q3. A 1,002,000 square-foot property located at 575 Old Forge Road, Jonestown is also expected to deliver in Q3. The Goodman Logistic Center Carlisle – Building 2 will deliver 938,828 square feet of space in Q2. Finally, Orchard Business Park II – Building A will deliver 780,000 square feet of space in Q4.

SELECT TOP SALES

Among the year’s select top sales, are three worth noting that took place in Central Pennsylvania. The Ames True Temper building in Carlisle (1,226,525 square feet) sold for $90,150,000 to Clarion Partners. Target Distribution Center in York (785,400 square feet) sold for $60,000,000 to AEW Capital Management. And the building at 100 Louis Parkway in Carlisle (400,596 square feet) sold for $28,850,000 to Industrial Property Trust.

ABSORPTION

2017 is setting records all around for industrial real estate in Central Pennsylvania. Q1 boasts the largest number of buildings in existing inventory (3,635) and the largest total RBA (262,658,186 square feet) we have ever seen. In less than four years, the local market gained 45 new buildings, with nine more under construction. Even with all of this new inventory entering the market, net absorption continues to increase, proving the demand for more space. Net absorption this quarter rose from 992,800 square feet to 2,107,328 square feet. This is the highest net absorption we’ve seen since Q2 2015 and the third highest since it plummeted into the negatives in Q2 2013.

VACANCY & RENTAL RATES

Total vacant space increased from 14,255,260 square feet to 14,392,303 square feet this quarter. Even with this increase, the vacancy rate holds steady at 5.5%, where it’s been since Q2 2016. The quoted rental rate also remains steady at $4.36. This is the highest price per square foot we’ve seen prior to Q2 2013, again proving a healthy demand for industrial real estate in Central Pennsylvania!

What trend from the first quarter did you find most interesting or impactful to Central Pennsylvania industrial space? Share your insights by leaving a comment below.

Learn more from past market reports:

Central Pennsylvania CRE Market Reports Q4 2016

Predictions for Trends and Changes in Commercial Real Estate in 2017

Influx of New Construction Impacts Central PA’s Industrial Real Estate Market

[Online Resources] Real Estate, central pennsylvania, Commercial Real Estate, Construction, costar, CRE, demand, expert, facts, first quarter, industrial, market report, Mike Kushner, more space, new space, Omni Realty Group, pennsylvania, space, statistics, supply, trends, vacancy

Influx of New Construction Impacts Central PA’s Industrial Real Estate Market

Posted on November 15, 2016 by Mike Kushner in Blog, Local Market, Trends No Comments

In the third quarter, we saw some interesting trends emerging in the local industrial real estate market that appear to be just the beginning of a bigger movement yet to come.

Five new buildings have already been delivered so far in 2016 and there are 11 more buildings under construction with a total RBA of 4,820,849 sqft of space. Furthermore, much of this space is currently unoccupied which will have a big impact on net absorption and vacancy rates, among other things.

Let’s take a look at the most important trends we saw take place in Q3 2016 in the Central Pennsylvania industrial real estate market followed by our analysis of the effect this will have on the market.

Select Year-to-Date Deliveries:

Five of the top 15 Select Year-to-Date Deliveries in the Greater Philadelphia market took place in Central PA. Of these five, two were delivered in Q1 and three were delivered in Q2. None were delivered in Q3. For a quick recap, here are the square footage and occupancy of the buildings that have been delivered in the Central PA market so far this year:

  • 139 Fredericksburg Road (Lebanon Valley Distribution Center), 874,126 sqft and 0% occupied
  • 545 Old Forge Road, 500,000 sqft and 0% occupied
  • 10874 2nd Amendment Drive (Susquehanna Logistics Center), 423,300 sqft and 100% occupied
  • 192 Kost Road, 422,400 sqft and 0% occupied
  • 501 Old Forge Road (LogistiCenter 78-81), 405,000 sqft and 100% occupied (in the Q4)

Top Under-Construction Properties:

A large construction project broke ground this quarter in Central PA. United Business Park, located off Interstate 81 in Southampton Township plans to add 1,491,600 sqft of industrial space to the market by Q2 2017. This is one of two distribution centers that combined will offer about 2.7 million sqft of space in Franklin County. New Jersey-based Matrix Development Group is among the most active industrial developers in Pennsylvania and New Jersey. Sheetz will be the first tenant in this space in this space and they hope to offer other large companies like Proctor and Gamble who want to efficiently reach the Northeast and Mid-Atlantic populations.

Select Top Sales

Four of the nine Select Top Sales in the Greater Philadelphia Market between July 2015 and September 2016 have taken place here in Central PA. Though none have taken place specifically in Q3, here is a quick recap of the building that have been sold during this time:

  • 1 True Temper Drive (Carlisle), 1,226,515 sqft for $90,150,000
  • 234 Walnut Bottom Road – Park 81 (Shippensburg), 1,495,720 sqft for $83,000,000
  • 100 Louis Parkway (Carlisle), 400,596 sqft for $28,850,000
  • 1225 S Market Street (Mechanicsburg), 596,703 sqft for $21,350,000

Absorption and Demand:

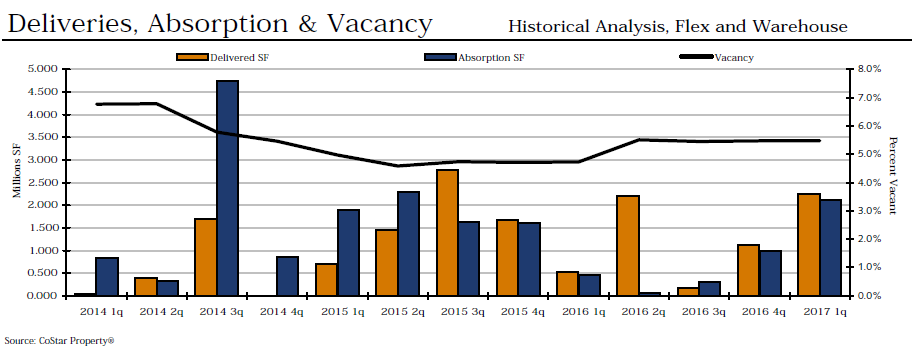
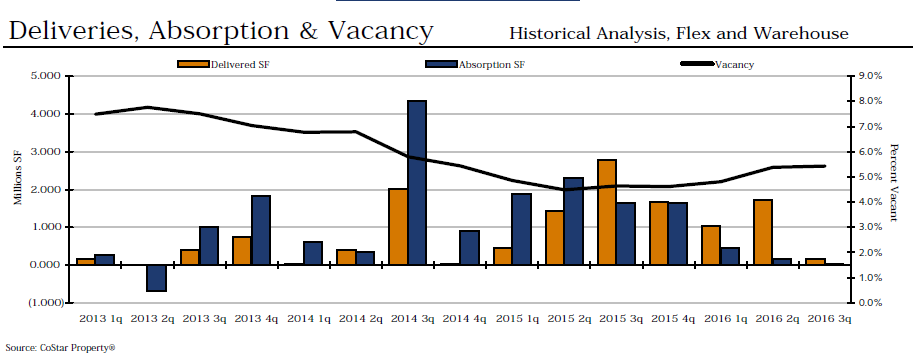
This quarter, net absorption fell drastically from 164,650 sqft (Q2) to 28,978 sqft. Though still in the black, this is the lowest number we’ve seen for net absorption since Q2 2013 when it dipped into the red at negative 683,020 sqft. Only one building was delivered this quarter with an RBA of 165,800 sqft which is currently not occupied. Additionally, 11 buildings are under construction with a total RBA of 4,820,849 sqft of new space coming to the market soon. From what we’ve seen in the Top Under-Construction properties in the Q3 CoStar report, many of these are 0% occupied at this time. Should more unoccupied space hit the market, we could expect to see net absorption decrease even further, possibly dipping into the red.

deliveries-absorption-and-demand

Vacancy & Rental Rate:

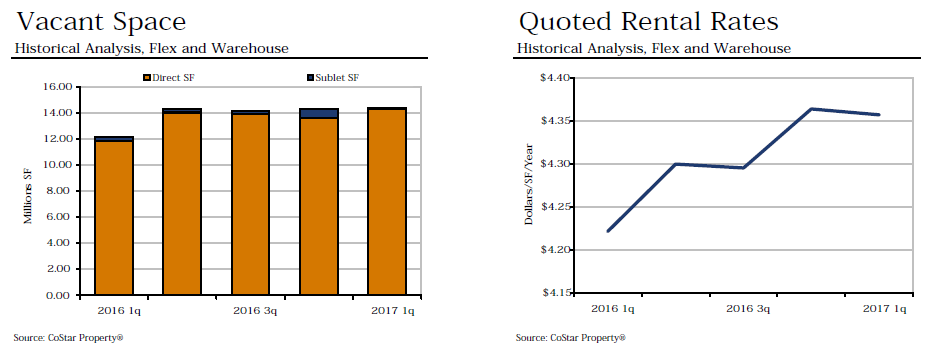
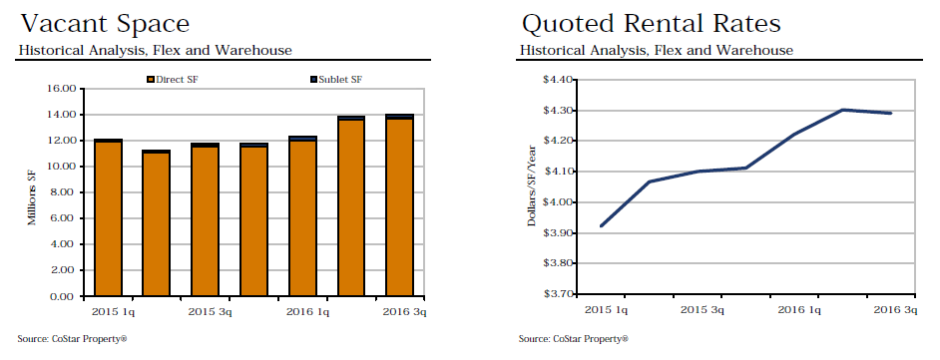
The vacancy rate remained the same this quarter at 5.4% after its big increase from Q1 to Q2 where it jumped 0.6% to the highest rate we’ve seen since Q4 2014. Given the projects under construction, we might expect this to increase further in the coming quarters as these properties are delivered. While vacancy stayed steady, the quoted rental rate decreased by 1 cent to $4.29 per square foot.

vacant-space-and-quoted-rental-rate

Our Summary:

Construction activity continues to be one of the prime drivers of the Central Pennsylvania industrial market. Speculative construction currently accounts for 70.5 percent of all construction projects.  New construction has created opportunities for tenants in a market that has otherwise been difficult to enter.  As developers noticed requirements are larger than quality options in the market, speculative projects broke ground to meet the needs of the active requirements.

Moving forward for the remainder of 2016, speculative construction will continue to exceed build-to-suit projects.  While demand continues to be strong, a large volume of construction has delivered vacant this year, likely causing market conditions to shift to tenant favorable by 2018 due to large increases in Class A inventory and pending economic slowdown.

Based upon the data for Central PA’s industrial real estate market in Q3 2016, what do you find to be most interesting or important? Share your insight by commenting below!

[Online Resources] Real Estate, analysis, blog, camp hill, carlisle, central pa, central pennsylvania, costar, cumberland, data, dauphin, facts, harrisburg, hershey, industrial, lancaster, lemoyne, mechanicsburg, Mike Kushner, new cumberland, news, numbers, Omni Realty, report, statistics, summary, trends, york

Median Household Incomes Mostly on the Rise for Central Pennsylvania

Posted on September 26, 2016 by Mike Kushner in Blog, Local Market, Trends No Comments

According to the data from the U.S. Census American Community Survey, released on September 15, Central Pennsylvania is following in suit with greater Philadelphia – and the rest of the nation – which is experiencing an increase in median household incomes. Taking into consideration Cumberland, Dauphin, Lancaster, Lebanon and York Counties, here are some of the most notable trends published in the report.

The highest median household income is Cumberland County at $63,890; in contrast, the lowest median household income is Lebanon County at $52,571. Lancaster County increased the most in the last year, by $1,859. Decreasing the most was Lebanon County, by $1,497.

Lancaster County has the lowest median income for Black or African American households at $32,445. While the lowest median income for Hispanic or Latino households is Lebanon County at $25,422. The greatest difference in median income between male versus female householder (with no spouse present) is $18,429 in Cumberland County.

For all counties, the highest median income was for householders between the ages of 45 to 64 years old and for households of married couple families. Also, female householders (with no spouse present) always earned less than male householders (with no spouse present).

If you’re curious what other trends emerged and what these trends tell us about the health of our local economy, let’s take a closer look at each county’s specific numbers.

Cumberland County, Pennsylvania

The 2016 median household income in Cumberland County is $63,890. This number is up from $62,759 in 2014 and is the highest median income we have seen this decade. For householders between the ages of 45 to 64 years old, the median income rises to $78,960. Households of married couple families have the highest median income at $87,714. A male householder with no wife present has a median income of $54,837. In contrast, a female householder with no husband present has a median income of just $36,408. Black or African American households had a median income of $32,661 and Hispanic or Latino households had a median income of $35,097.

Dauphin County, Pennsylvania

The 2016 median household income in Dauphin County is $54,232. Up from $52,975 in 2014, this number has been on an almost steady rise for the last decade. For householders between the ages of 45 to 64 years old, the median income rises to $63,373. Households of married couple families have the highest median income at $79,328. A male householder with no wife present has a median income of $46,430. In contrast, a female householder with no husband present has a median income of just $35,520. Black or African American households had a median income of $37,823 and Hispanic or Latino households had a median income of $33,947.

Lancaster County Pennsylvania

The 2016 median household income in Lancaster County is $59,262. This county experienced the greatest increase in the Central PA region over the last year. Rising from $57,403 by $1,859, this is also the highest number we have seen this decade, which is especially notable since median income took a dip in 2010, falling to $51,740.

For householders between the ages of 45 to 64 years old, the median income rises to $73,155. Households of married couple families have the highest median income at $78,218. A male householder with no wife present has a median income of $47,391. In contrast, a female householder with no husband present has a median income of just $36,925. Black or African American households had a median income of $32,445 and Hispanic or Latino households had a median income of $38,125.

Lebanon County Pennsylvania

The 2016 median household income in Lebanon County is $52,571. Down from 2014’s median income of $54,068, Lebanon County experienced several ups and downs throughout the past decade. For householders between the ages of 45 to 64 years old, the median income rises to $60,578. Households of married couple families have the highest median income at $73,219. A male householder with no wife present has a median income of $44,239. In contrast, a female householder with no husband present has a median income of just $34,383. Black or African American households had a median income of $34,662 and Hispanic or Latino households had a median income of $25,422.

York County, Pennsylvania

The 2016 median household income in York County is $58,409. This was another Central PA county that decreased since 2014, though ever so slightly by just $178 ($58,587 in 2014). With several ups and downs in median income, the number has still mostly been on the rise over the past decade.

For householders between the ages of 45 to 64 years old, the median income rises to $72,004. Households of married couple families have the highest median income at $81,711. A male householder with no wife present has a median income of $46,681. In contrast, a female householder with no husband present has a median income of just $33,911. Black or African American households had a median income of $44,525 and Hispanic or Latino households had a median income of $33,182

Our Analysis

Increasing median household income is just one trend that affects commercial real estate. The local employment gains continue to be strong, with seasonally adjusted unemployment rate holding below 5.0 percent. This adds to the demand for housing in a variety of forms: for office space, for the retail sector and for industrial/distribution facilities.

Underlying inflation is extremely tame, providing no impetus for significantly higher rates. Lending rates and fixed income rates of return will remain low by historical standards. For most metro areas (including Central Pennsylvania) and property types, lower oil prices have been a net positive. Spending less on gasoline encourages consumers to spend more on other items, which helps retail and hotel market fundamentals.

Lower prices directly translate into an increase in household disposable income. Overall, the commercial property market in 2017 will continue to be characterized by strong fundamentals, increased investor flows and high transaction volume.

What median income was most surprising to you? What do you think some these trends say about the health of our local economy? Share your thoughts by commenting below!

[Online Resources] Real Estate, analysis, average, budget, central pa, central pennsylvania, commercial, data, debt, facts, income, market, median, Mike Kushner, money, news, Omni Realty Group, pennsylvania, people, poverty, prediction, report, statistics, stats, trends
  • 1
  • 2
  • 3

Subscribe To Our Blog

  • This field is for validation purposes and should be left unchanged.

Mike J Kushner, CCIM

  • Contact me for a FREE Lease Review!
  • This field is for validation purposes and should be left unchanged.

Categories

  • About Us
  • Blog
  • CCIM
  • Commercial Real Estate
  • Community
  • Construction
  • CPBJ Articles
  • CREDC Articles
  • Feature
  • Featured Opportunities
  • Guest Blogger
  • Healthcare
  • In the News
  • Industrial
  • Local Market
  • Office Leasing
  • Retail
  • Success Stories
  • Tenant Representative/Buyer Agent
  • Trends

(c) 2019 OMNI REALTY GROUP- Website Design by The John Webster Company