OMNI Realty Group
  • Email
  • Facebook
  • Linkedin
  • Twitter
  • Rss
  • Home
  • Omni Advantage
    • Success Stories
    • Our Clients
    • Completed Deals
    • In the News
  • Services
  • Resources
    • Local Market
    • Office Space Calculator
    • CCIM Advantage
      • User Investment
      • CCIM Brochure
      • Total Expertise
      • Distinguish Yourself
      • How Would You Rate
  • Global Reach
  • Property Search
  • FAQ
  • Blog
  • Contact Us

Posts tagged "analysis"

Home» Posts tagged "analysis"

Central PA Office Submarkets End Quarter with Very Different Outcomes

Posted on November 8, 2018 by Mike Kushner in Blog, Local Market, Trends No Comments

Lancaster closes Q3 with the strongest market while Harrisburg West shows signs of distress.

The submarkets that make up Central Pennsylvania’s office real estate market each have unique advantages and disadvantages that really show through when you examine each individually. With the close of the third-quarter, we took a closer look at how the four main submarkets performed individually and comparatively.

The outcomes should surprise you! You may think you know which of the four submarkets outperformed the others, which one is most likely in distress and the others that are sitting pretty stagnant right now. But you’ll likely be shocked by the large variances in numbers, especially when compared to the historical averages and forecasted averages of what is yet to come.

Let’s take a closer look at some of the most interesting trends and numbers reported from CoStar’s Q3 2018 office report for Harrisburg East, Harrisburg West, Lancaster and York.

Harrisburg East

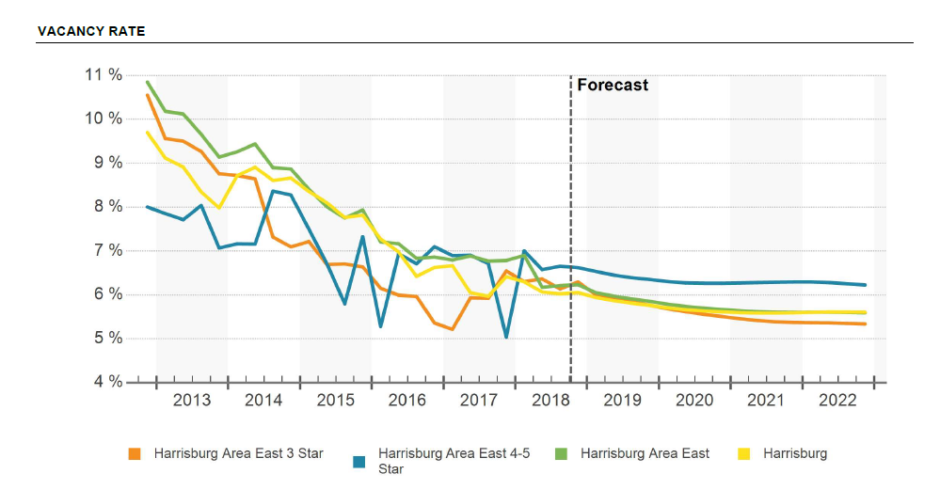
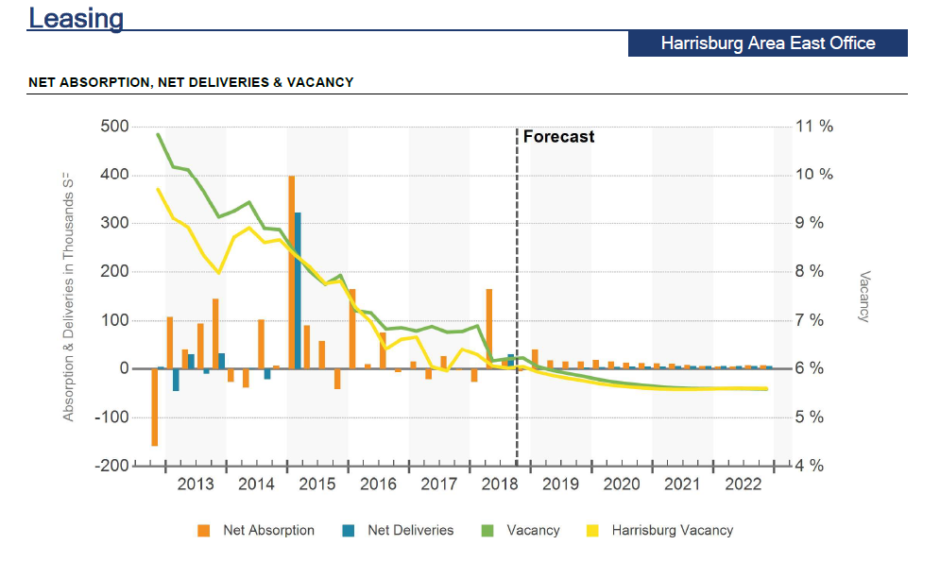
Vacancy – The vacancy rate for Q3 2018 in the Harrisburg East submarket is 6.4%. This is notably lower than the historical average of 7.8% and the forecast average shows this dipping lower to 5.7%. For comparison, the peak in vacancy rate occurred in Q4 2012 when it reached 10.8% and the trough was in Q4 1997 when it plummeted to 3.1%.

12 Month Net Absorption in SF – The twelve-month net absorption is 106,000 square-feet. While this is still lower than the historical average of 187,046 square-feet, the forecast average predicts the current net absorption will fall significantly to 61,648 square-feet. Though not by much, net absorption will at least remain in the black for now.

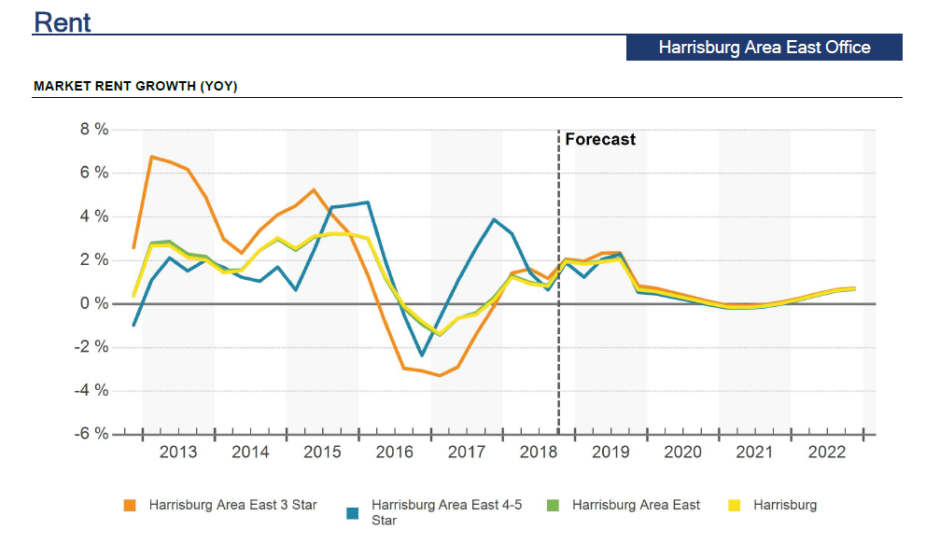
Rent Growth – The current 12 month rent growth is 2.0%. This is higher than the historical average of 1.4%, though the forecast average predicts that this will fall to 0.7%. For comparison, the peak in Harrisburg East’s rent growth occurred in Q1 2001 when it reached 8.3% and the trough was in Q4 2009 when it plummeted to -2.4%.

12 month deliveries in SF – Harrisburg East has a twelve-month delivery of 30,000 square-feet. This takes into account all of the deliveries that occurred over the last year; however no new buildings were delivered specifically in Q3 2018. Additionally, 20,000 square-feet of 4 and 5 star office space is under construction, which will be delivered in coming quarters.

Harrisburg West

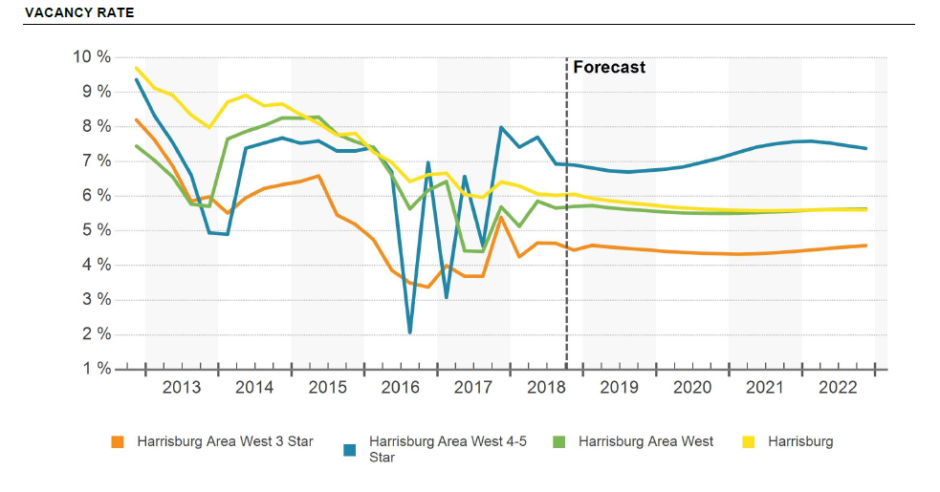
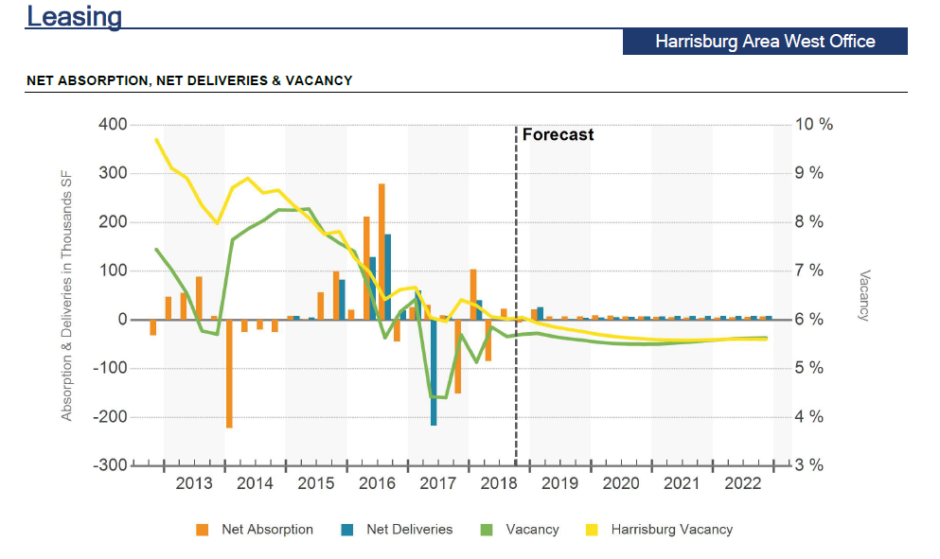
Vacancy – The vacancy rate for Q3 2018 in the Harrisburg West submarket is 7.3%. This is slightly higher than the historical average of 7.0%; however, CoStar’s forecast average predicts this to dip to 5.6%. For comparison, the peak in vacancy rate occurred in Q2 2002 when it reached 9.8% and the trough was in Q4 1997 when it plummeted to 2.5%.

12 Month Net Absorption in SF – The twelve-month net absorption is negative 258,000 square-feet. The historical average is 95,454 square-feet and the forecast average predicts the market will again return to positive numbers with 25,193 square-feet. Q3 net absorption is not far from where it was in Q4 2014 when it was negative w 292,042 square-feet. Since then, it peaked in Q3 2016 at 611,057 square-feet before falling substantially to its current negative state.

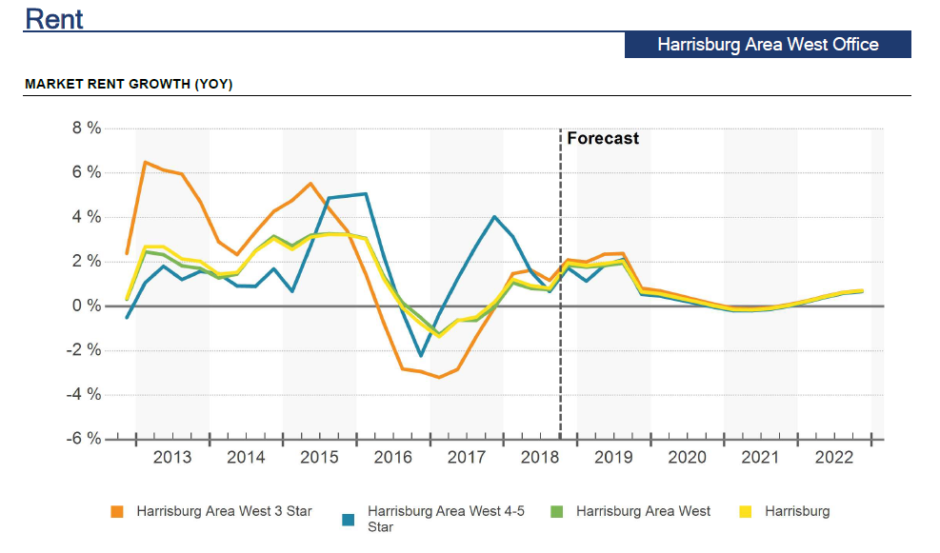
Rent Growth – The current 12 month rent growth is 1.9%. This is higher than the historical average of 1.4%, though the forecast average predicts that this will fall to 0.6%. For comparison, the peak in Harrisburg West’s rent growth occurred in Q3 2000 when it reached 7.1% and the trough was in Q4 2009 when it plummeted to -2.8%.

12 month deliveries in SF – Harrisburg West has a twelve-month delivery of 40,000 square-feet, compared to the historical average of 127,660 square-feet. This takes into account all of the deliveries that occurred over the last year; however no new buildings were delivered specifically in Q3 2018. Additionally, 26,400 square-feet of 3 star office space is under construction, which will be delivered in coming quarters.

Lancaster

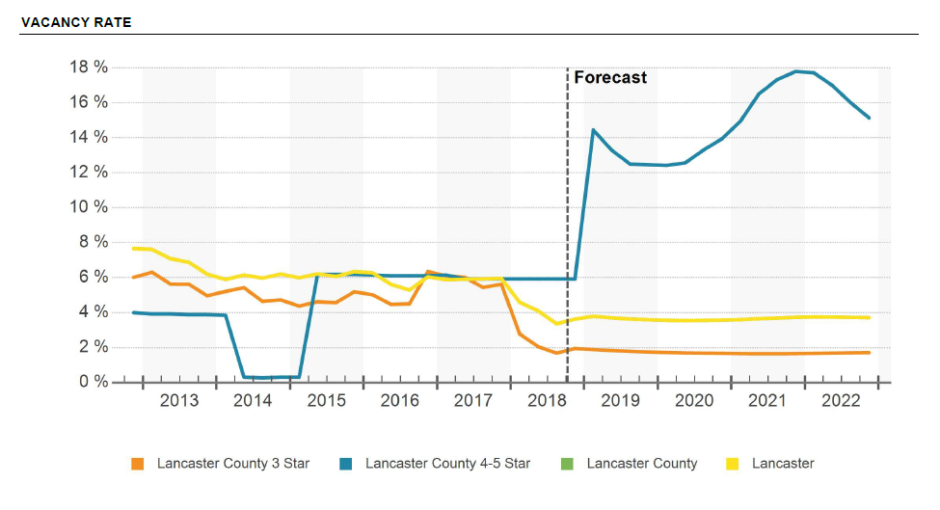
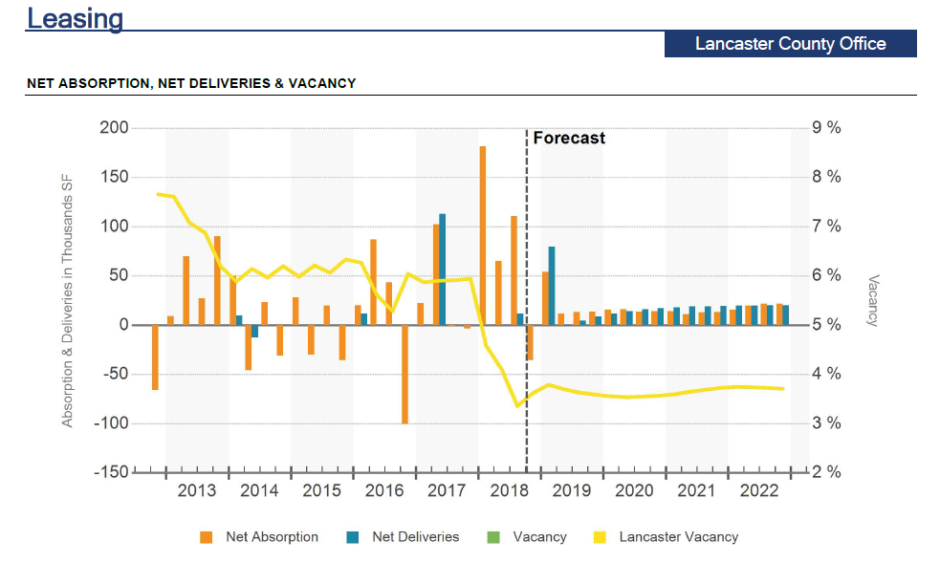
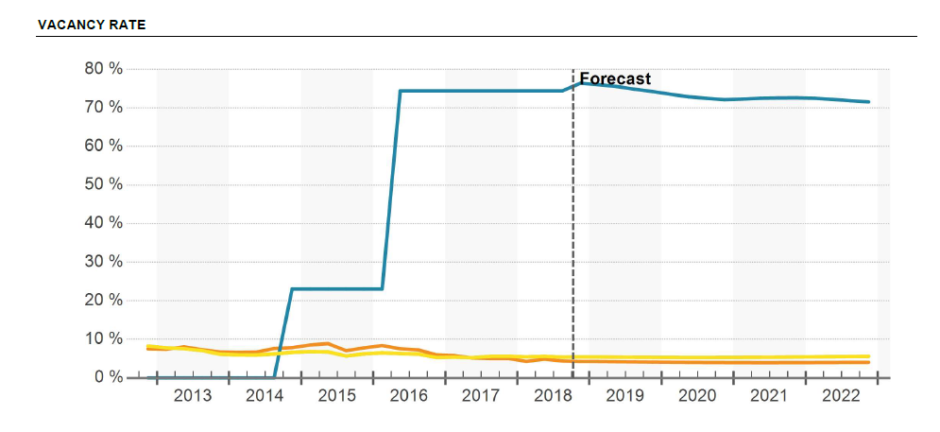
Vacancy – The vacancy rate for Q3 2018 in the Lancaster submarket is 3.6%. This is notably lower than the historical average of 6.8%; the forecast average predicts this remain fairly stable at 3.7%. For comparison, the peak in vacancy rate occurred in Q4 2004 when it reached 9.7%. The lowest the vacancy rate has ever been in Lancaster County is actually right now, in Q3 2018.

12 Month Net Absorption in SF – The twelve-month net absorption is 324,000 square-feet. The historical average is substantially lower than what it is currently and that is 109,103 square-feet. The forecast average predicts net absorption will decrease to 89,086 square-feet.

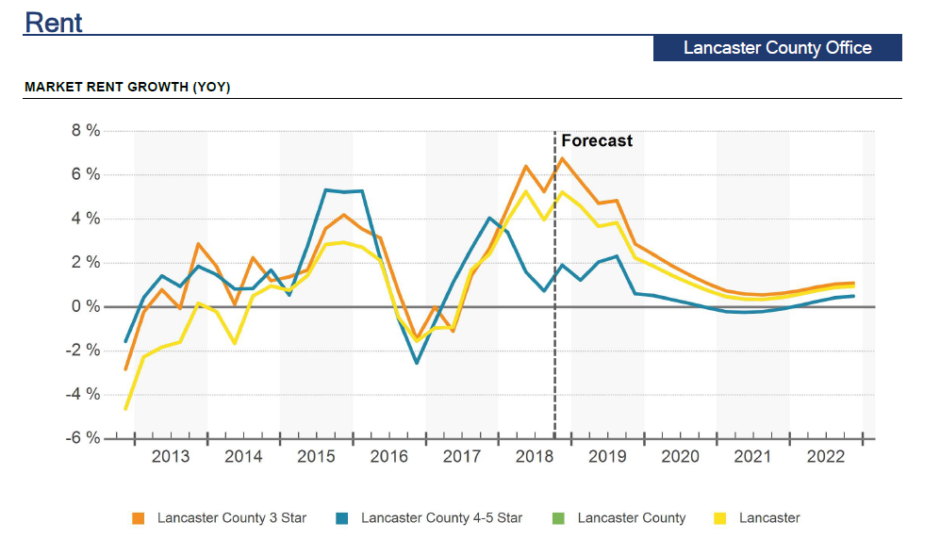
Rent Growth – The current 12 month rent growth is 4.9%. This is significantly higher than the historical average of 1.3%, though the forecast average predicts that this will fall to 1.6%. For comparison, the peak in Lancaster’s rent growth occurred in Q3 2000 when it reached 6.9% and the trough was in Q4 2009 when it plummeted to -5.0%.

12 month deliveries in SF – Lancaster has a twelve-month delivery of 12,000 square-feet, compared to the historical average of 114,237 square-feet. This takes into account all of the deliveries that occurred over the last year; however no new buildings were delivered specifically in Q3 2018. Additionally, 81,840 square-feet of 4 and 5 star office space is under construction, which will be delivered in coming quarters.

York

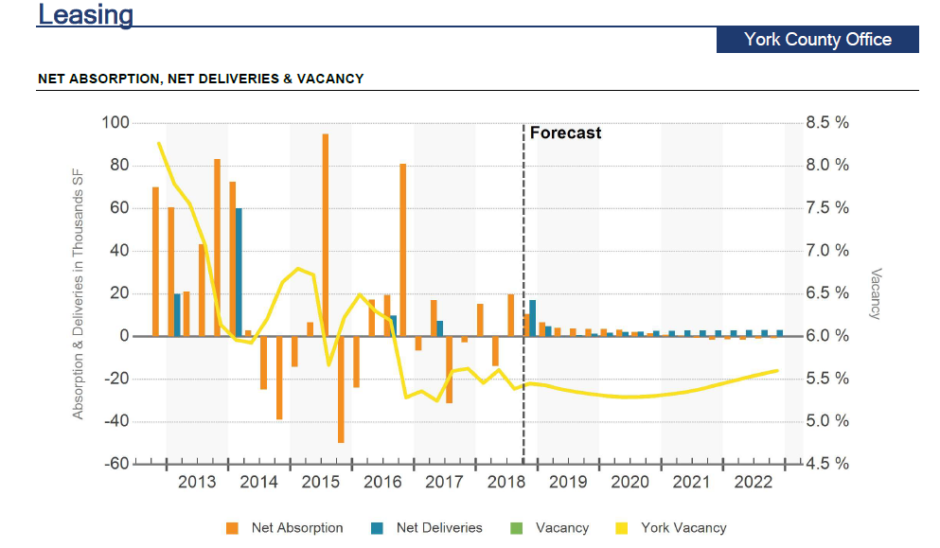
Vacancy – The vacancy rate for Q3 2018 in the York submarket is 5.3%. This is lower than the historical average of 6.9%; the forecast average predicts this remain fairly stable at 5.4%. For comparison, the peak in vacancy rate occurred in Q1 2008 when it reached 10.5%. The lowest the vacancy rate has ever been was 2.2% in Q4 1998.

12 Month Net Absorption in SF – The twelve-month net absorption is 29,500 square-feet. The historical average is 72,892 square-feet. The forecast average predicts net absorption will decrease to 8,847 square-feet.

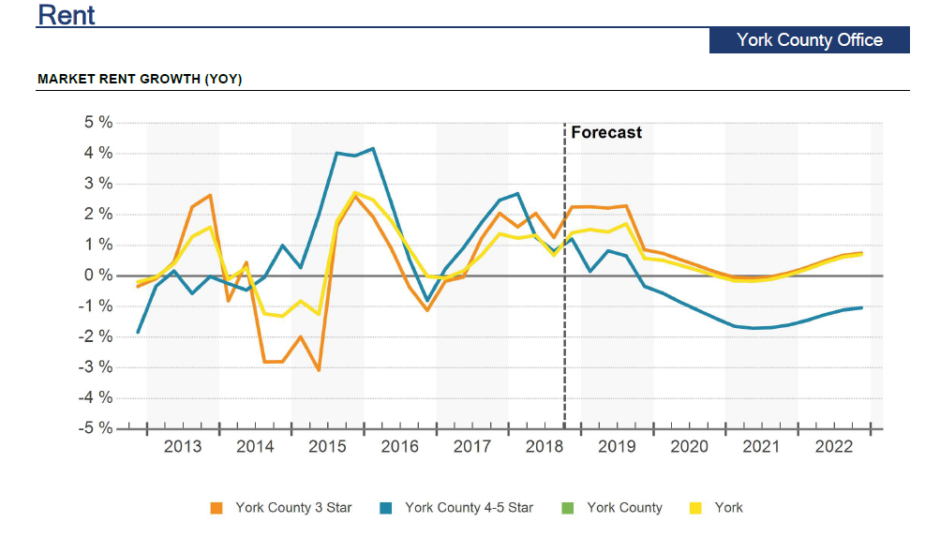
Rent Growth – The current 12 month rent growth is 1.6%. This is fairly close in line with the historical average of 1.1%, though the forecast average predicts that this will fall to 0.6%. For comparison, the peak in York’s rent growth occurred in Q3 2000 when it reached 6.8% and the trough was in Q3 2009 when it plummeted to -4.3%.

12 month deliveries in SF – York has a twelve-month delivery of 0 square-feet, compared to the historical average of 80,056 square-feet. The forecast average predicts that this rise to 13,093 square-feet. Additionally, 22,000 square-feet of office space is under construction, 17,000 square-feet of 4 and 5 star space and 5,000 square-feet of 3 star space, which will be delivered in coming quarters.

Key Takeaways

Overall, York County and Harrisburg East have been very stable. Not much is moving the needle. There is not a lot of absorption nor much new construction that could spur activity.

The real positive news from Q3 2018 is Lancaster County. This submarket rose above the rest for several reasons. First is its 324,000 square-feet in net absorption and 4.9% rent growth (highest since Q3 2003). Additionally the vacancy rate decreased 2.3%. Currently there are 81,840 square-feet under construction and 89,166 square-feet of new construction proposed.

In contrast, the Harrisburg West submarket is showing signs of distress. Its negative 282,000 square-feet of net absorption combined with a modest vacancy rate increase of 1.6% does not offer much hope for a major turnaround anytime soon. Additionally, the submarket has 86,400 square-feet of new office space under construction and 225,596 square-feet of proposed new space that the market will struggle to absorb, further driving down the net absorption.

Based on the activity taking place in Central Pennsylvania’s office real estate submarkets, how do you think this will impact business growth and development throughout these counties? How will this have a ripple effect into other areas of our economy?

Share your ideas by leaving a comment below!

[Online Resources] Real Estate, analysis, central pa, Class A, Class B, Class C, Commercial Real Estate, commercial real estate agent, commercial real estate broker, costar, east, harrisburg, lancaster, local, market, Mike Kushner, office, office real estate, Office Space, Omni Realty Group, pennsylvania, real estate agent, real estate broker, realty, report, stats, tenant representative, trends, west, york

Central Pennsylvania Industrial Real Estate Report for Q2 2017

Posted on July 17, 2017 by Mike Kushner in Blog, Local Market, Trends No Comments

Net absorption falls by 3.5 million square-feet with more space to come!

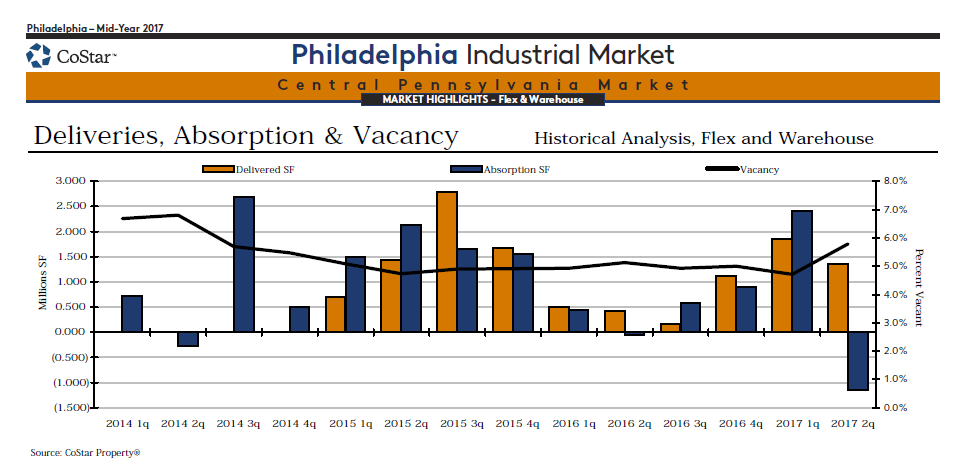
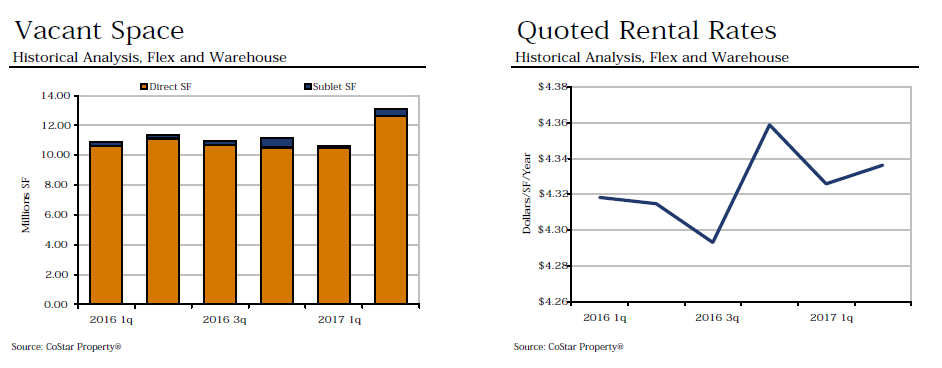
In the first quarter of 2017, the Central Pennsylvania industrial real estate market* gained more than two million square-feet of new space. Now into the second quarter, the rate at which we’re adding new space has slowed, but the market is still trying to absorb what was dumped into it earlier this year. As a result, net absorption fell into the negatives, decreasing by more than 3.5 million square-feet from last quarter. The vacancy rate also rose by more than a whole percentage point. Most interestingly, the quoted rental rate actually rose by a penny, placing it back near the recent record high we saw at the end of 2016.

How does this all tie together and what does it mean for the future of Central Pennsylvania’s industrial real estate market? Take a look!

SELECT YEAR-TO-DATE DELIVERIES

As far as new deliveries, Q2 slowed considerably from what we experienced in Q1. Within the first quarter of 2017, Central Pennsylvania received five new industrial properties, totaling a combined 2,244,371 square-feet of space. Now in the second quarter, just three new buildings were completed and added a total of 1349,697 square-feet to the market. Two of these buildings ranked among CoStar’s top 15 select-year-to-date deliveries. Goodman Logistics Center, Building 2 in Carlisle was completed this quarter, adding 938,828 square-feet of unleased space to the market. The other building, located at 53 Commerce Drive in Mechanicsburg, delivered 340,869 square-feet of space, which is 40% occupied.

SELECT TOP UNDER CONSTRUCTION PROPERTIES

Looking forward, Central Pennsylvania stands to gain a considerable amount of new industrial space in the coming year. Five properties are under construction and are set to be delivered later this year and into 2018. The largest is located at 100 Fry Drive in Mechanicsburg with 1.1 million square-feet of fully preleased space that will be completed next quarter. The second largest is Orchard Business Park II, Building A, in York with 780,000 square-feet of unleased space that will be completed in the fourth quarter of 2017. Additionally, the former Quaker Oats manufacturing and distribution facility, located at 485 St. Johns Church Road in Hampden Township, is being renovated into a smaller, modern warehouse facility. The renovation and expansion work will be done by April 2018, and the new warehouse section will be done by next July.

SELECT TOP SALES

Within the last two months, three buildings in Carlisle have sold, totaling an exchange of 2,222,121 square-feet of industrial space. The largest is the Ames True Temper Building with 1,226,525 square-feet which sold for $90,150,000 to Clarion Partners. Located at 1 Ames Drive in Carlisle is 595,000 square-feet of industrial space that sold to UPS for $55 million. Finally, at 100 Louis Parkway, 400,596 square-feet of space sold to Industrial Property Trust for $28,850,000.

ABSORPTION

Net absorption fell significantly this quarter, plummeting to a negative 1,1446,892 square-feet. This is a large drop from the positive net absorption of 2,402,682 square-feet we saw just last quarter. This is the lowest net absorption has been since prior to 2013. With five buildings delivered last quarter, three delivered this quarter, and five more under construction, the rise or fall of future net absorption will be mostly determined by the ability to lease out all of this new space.

VACANCY & RENTAL RATES

As you might expect, based upon other trends, Central Pennsylvania’s vacancy rate for industrial space rose from 4.7% last quarter to 5.8% this quarter. Vacant space also rose by more than 3 million square-feet. Even with negative net absorption and an increase in vacancy rate, the quoted rental rate rose ever so slightly. It is now $4.34, nearly back to the recent record high we experienced at the end of 2016 when it reached $4.36. It will be interesting to watch how the market reacts to the recent influx of new space, further impacting the vacancy and rental rates for Q3 and beyond.

What trend from the second quarter did you find most interesting or impactful to Central Pennsylvania industrial space? Share your insights by leaving a comment below.

*For the purposes of this article, the Central Pennsylvania market is defined as Dauphin, Cumberland, York, Lancaster and Adams Counties.

Learn more from past market reports:

Central Pennsylvania Industrial Real Estate Report for Q1 2017

Amidst Massive Retail Closings, Central PA Commercial Real Estate Continues to Grow

Central PA’s Office Real Estate Market Hangs on to Low Vacancy, Slows Down on Net Absorption

analysis, central pa, central pennsylvania, Commercial Real Estate, data, dillsburg, harrisburg, hershey, industrial, lancaster, lemoyne, market, mechanicsburg, Mike Kushner, new cumberland, news, pennsylvania, report, statistics, trends, warehouse, york

Influx of New Construction Impacts Central PA’s Industrial Real Estate Market

Posted on November 15, 2016 by Mike Kushner in Blog, Local Market, Trends No Comments

In the third quarter, we saw some interesting trends emerging in the local industrial real estate market that appear to be just the beginning of a bigger movement yet to come.

Five new buildings have already been delivered so far in 2016 and there are 11 more buildings under construction with a total RBA of 4,820,849 sqft of space. Furthermore, much of this space is currently unoccupied which will have a big impact on net absorption and vacancy rates, among other things.

Let’s take a look at the most important trends we saw take place in Q3 2016 in the Central Pennsylvania industrial real estate market followed by our analysis of the effect this will have on the market.

Select Year-to-Date Deliveries:

Five of the top 15 Select Year-to-Date Deliveries in the Greater Philadelphia market took place in Central PA. Of these five, two were delivered in Q1 and three were delivered in Q2. None were delivered in Q3. For a quick recap, here are the square footage and occupancy of the buildings that have been delivered in the Central PA market so far this year:

  • 139 Fredericksburg Road (Lebanon Valley Distribution Center), 874,126 sqft and 0% occupied
  • 545 Old Forge Road, 500,000 sqft and 0% occupied
  • 10874 2nd Amendment Drive (Susquehanna Logistics Center), 423,300 sqft and 100% occupied
  • 192 Kost Road, 422,400 sqft and 0% occupied
  • 501 Old Forge Road (LogistiCenter 78-81), 405,000 sqft and 100% occupied (in the Q4)

Top Under-Construction Properties:

A large construction project broke ground this quarter in Central PA. United Business Park, located off Interstate 81 in Southampton Township plans to add 1,491,600 sqft of industrial space to the market by Q2 2017. This is one of two distribution centers that combined will offer about 2.7 million sqft of space in Franklin County. New Jersey-based Matrix Development Group is among the most active industrial developers in Pennsylvania and New Jersey. Sheetz will be the first tenant in this space in this space and they hope to offer other large companies like Proctor and Gamble who want to efficiently reach the Northeast and Mid-Atlantic populations.

Select Top Sales

Four of the nine Select Top Sales in the Greater Philadelphia Market between July 2015 and September 2016 have taken place here in Central PA. Though none have taken place specifically in Q3, here is a quick recap of the building that have been sold during this time:

  • 1 True Temper Drive (Carlisle), 1,226,515 sqft for $90,150,000
  • 234 Walnut Bottom Road – Park 81 (Shippensburg), 1,495,720 sqft for $83,000,000
  • 100 Louis Parkway (Carlisle), 400,596 sqft for $28,850,000
  • 1225 S Market Street (Mechanicsburg), 596,703 sqft for $21,350,000

Absorption and Demand:

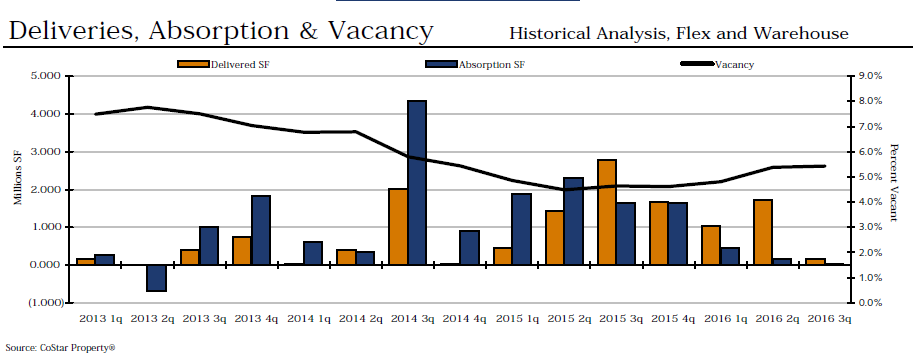
This quarter, net absorption fell drastically from 164,650 sqft (Q2) to 28,978 sqft. Though still in the black, this is the lowest number we’ve seen for net absorption since Q2 2013 when it dipped into the red at negative 683,020 sqft. Only one building was delivered this quarter with an RBA of 165,800 sqft which is currently not occupied. Additionally, 11 buildings are under construction with a total RBA of 4,820,849 sqft of new space coming to the market soon. From what we’ve seen in the Top Under-Construction properties in the Q3 CoStar report, many of these are 0% occupied at this time. Should more unoccupied space hit the market, we could expect to see net absorption decrease even further, possibly dipping into the red.

deliveries-absorption-and-demand

Vacancy & Rental Rate:

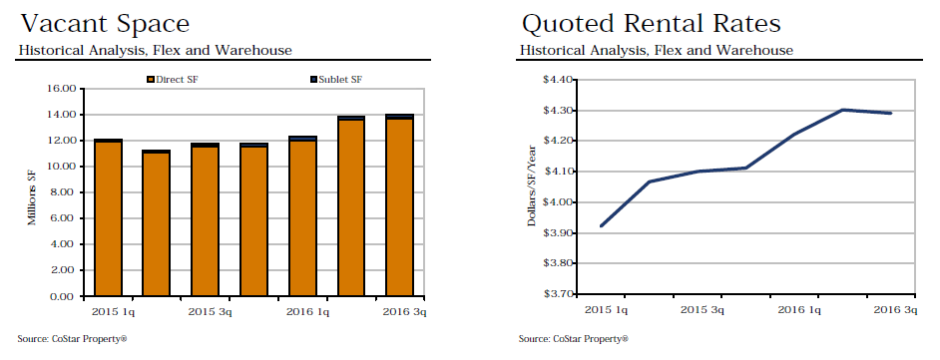
The vacancy rate remained the same this quarter at 5.4% after its big increase from Q1 to Q2 where it jumped 0.6% to the highest rate we’ve seen since Q4 2014. Given the projects under construction, we might expect this to increase further in the coming quarters as these properties are delivered. While vacancy stayed steady, the quoted rental rate decreased by 1 cent to $4.29 per square foot.

vacant-space-and-quoted-rental-rate

Our Summary:

Construction activity continues to be one of the prime drivers of the Central Pennsylvania industrial market. Speculative construction currently accounts for 70.5 percent of all construction projects.  New construction has created opportunities for tenants in a market that has otherwise been difficult to enter.  As developers noticed requirements are larger than quality options in the market, speculative projects broke ground to meet the needs of the active requirements.

Moving forward for the remainder of 2016, speculative construction will continue to exceed build-to-suit projects.  While demand continues to be strong, a large volume of construction has delivered vacant this year, likely causing market conditions to shift to tenant favorable by 2018 due to large increases in Class A inventory and pending economic slowdown.

Based upon the data for Central PA’s industrial real estate market in Q3 2016, what do you find to be most interesting or important? Share your insight by commenting below!

[Online Resources] Real Estate, analysis, blog, camp hill, carlisle, central pa, central pennsylvania, costar, cumberland, data, dauphin, facts, harrisburg, hershey, industrial, lancaster, lemoyne, mechanicsburg, Mike Kushner, new cumberland, news, numbers, Omni Realty, report, statistics, summary, trends, york

In the Wake of the Failed Merger, 6 Ways PinnacleHealth and Hershey Medical Center Can Harness New Growth

Posted on November 3, 2016 by Mike Kushner in Blog, Healthcare, Local Market No Comments

Healthcare costs

As shared by the Central Penn Business Journal, the Hershey-Pinnacle merger was recently opposed by the Federal Trade Commission (FTC) and the Pennsylvania Attorney General’s Office. The reason for this decision was explained as the Dauphin County-based hospitals are direct competitors, and that their union would eliminate competition in the Harrisburg region. For Harrisburg area residents and employers, a reduction in (or elimination of) competition may result in lower quality and higher cost health care.

While this ruling is a huge blow to what PinnacleHealth and Hershey Medical Center surely felt was a smart business move, it’s not likely stop the two entities’ from pursing alternative business growth opportunities.

The ACA has made the healthcare environment a market share game. So health systems are pursuing volume drivers for their systems, which means putting primary care and urgent care clinics in strategic locations. Among the popular pathways to growth for hospitals and health systems, we expect to see Pinnacle Health and Hershey Medical Center employ some or all of the following opportunities in the near future.

  1. Increase in ambulatory care facilities (i.e. freestanding urgent care, outpatient surgery and imaging centers and emergency care centers). Out-patient centers are an important and cost-effective alternative to higher cost inpatient-focused acute strategies. A health system can greatly increase the number of patients it can see and treat in a day through the operation of freestanding urgent care locations. This follows the trend of the new hub and spoke healthcare delivery model where the hub of a single network branches out into various locations to increase accessibility and efficiency.
  2. Recruitment or acquisition of medical groups that are in-market, but not fully aligned with the hospital. As healthcare reform continues, the number of insured patients seeking access to care will also increase. Therefore, it’s important for a health system to have the added capacity to monetize this growth. Additionally, patients often choose to follow their physicians regardless of hospital affiliation, meaning those with the most aligned physicians will grow the most.
  3. Clinical program development and service expansions or extensions. Health systems that actively seek opportunities to expand the scope of services they provide, such as adding new procedures, diagnostic categories, or subspecialties into their portfolio, are well positioned for growth. The complexity of healthcare and health insurance incentivizes patients to seek all of their care from a single organization, when possible. The more services a health system provides, the less likely a patient will seek care from a competing network.
  4. Geographic market expansion to establish additional locations of care. More and more, healthcare is beginning to look and act like typical retail marketplaces. One example is a preference for convenient venues and access locations. Health systems that extend their reach geographically can raise their growth trajectory. Most importantly, each location should consider its targeted populations so that the services provided meet the most common demands of that specific area.
  5. Merger or acquisition of another hospital or health system (including assets, “book-of-business,” and affiliated provider network). Establishing new locations through merger or acquisition is a fast track to growth. While the Hershey-Pinnacle merger was shot down, it’s not unlikely that they will seek out other possible mergers that do not conflict in the same way. Let’s face it, mergers provide a lot of benefits, including access to efficiencies through combining resources, and the opportunity to grow market position in key centers of excellence, institutes or hallmark clinical programs.
  6. Joint ventures. When market entry or start-up costs pose challenges, joint ventures remain a viable pathway to growth. While the legal nuances are about as complex as a merger or acquisition, with careful evaluation, the benefits can outweigh the effort. One of the biggest advantages of a joint venture is that it creates shared obligation among the parties involved so that everyone is working toward its sustainability and success.

Some Final Thoughts

Due to the changes imposed by the ACA, healthcare is moving toward a new kind of hub-and-spoke model where the focus is for more care to be delivered in the outpatient setting where costs can be reduced, access can be increased and preventative and post-acute care can be administered in a more efficient manner.

While other health systems have successfully teamed up to expand their reach, such as Penn Medicine and Lancaster General Health; Johns Hopkins Children’s Center and WellSpan Health; and Holy Spirit and Geisinger Health System, these partnerships cover entirely separate markets, unlike the proposed merger between PinnacleHealth and Hershey. If there’s anything that can be learned from the failed merger, it’s that an emphasis needs to be placed on better defining geographic markets to avoid the perception of conflict in the future.

What are your thoughts on the failed Hershey-Pinnacle merger and how this will impact their growth strategy for the future? Join in the conversation by leaving a comment!

acquisition, analysis, attorney general, business, central penn business journal, commentary, development, expansion, ftc, growing, growth, health system, healthcare, healthcare industry, hershey medical center, hospital, law, legal, medical, medicine, merger, Mike Kushner, monopoly, news, Omni Realty Group, opinon, partnership, pennsylvania, pinnaclehealth

Central PA’s Office Market Sets Recent Records for Vacancy, RBA and Rental Rates!

Posted on October 19, 2016 by Mike Kushner in Blog, Local Market, Trends No Comments

At first glance, it didn’t appear like Q3 2016 held any exciting news for Central Pennsylvania’s office real estate market. No top sales, no major projects delivered and only a couple projects under construction. But as we dug a little deeper into the numbers, we found that this quarter claimed recent record highs for RBA and quoted rental rates, as well as a record low for vacancy rate.

Together, these trends tell us that good things are happening within the local office real estate market, with numbers that continue to indicate growing demand. Let’s take a closer look at the highlights from Q3 2016 which we can use to analyze the current market and predict future trends.

Select Year-to-Date Deliveries:

CoStar’s list of Select Year-to-Date Deliveries includes two properties in Central Pennsylvania. Though none of these were delivered in Q3, it’s worth recapping that activity that has taken place so far in 2016. The Sterling Place Corporate Center in Mechanicsburg was delivered in Q2 with 129,000 square-feet of fully leased space. At 440 Walker Road, Chambersburg, 9,199 square-feet of space was delivered in Q1. Only 63% was preleased.

Top Under-Construction Properties:

Although no new properties were delivered in Q3, we expect to see at least one new office building delivered to the Central PA market in Q4. This property, located on Hogestown Road in Mechanicsburg, will add 129,000 square-feet of office space. It is 100% preleased.

Absorption and Demand:

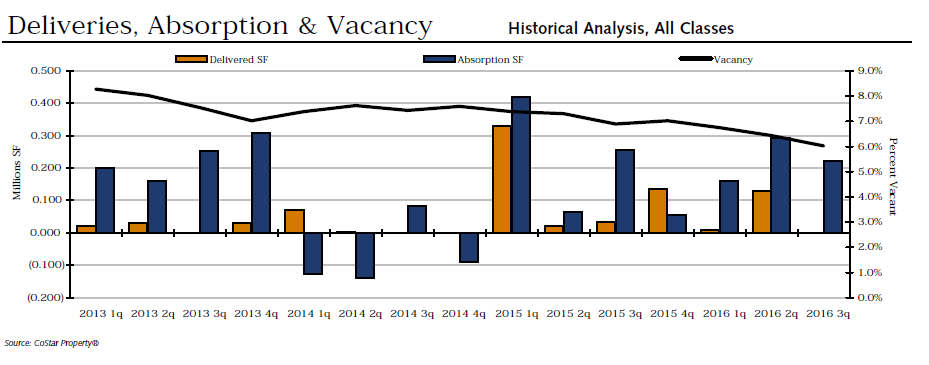
Net absorption dropped this quarter by 70,917 square-feet. There has been a lot of fluctuation in net absorption from quarter to quarter and this continues in line with the trend. Total RBA did not budge from last quarter which was 54,902,624 square-feet. This maintains the recent record high that we reached in Q2, the highest RBA in Central PA since prior to Q4 2012.

deliveries-absorption-and-vacancy-q3-office

Vacancy & Rental Rate:

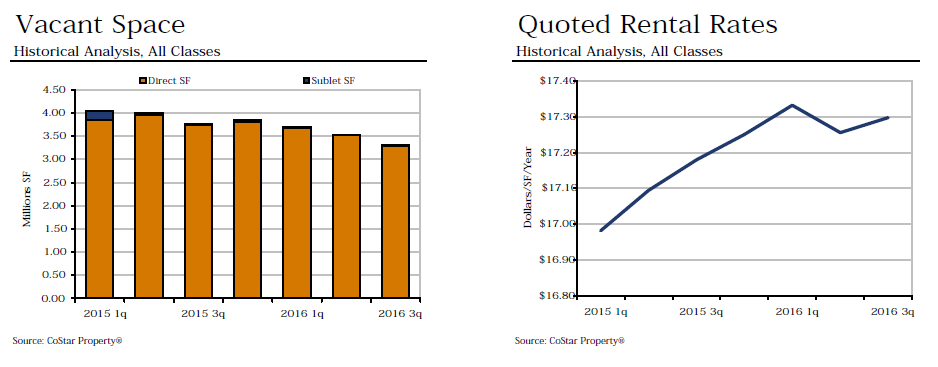
Vacancy decreased again this quarter to a recent record low of 6.0%. This is the lowest vacancy rate we have experienced since prior to Q4 2012. As might be expected with a decrease in vacancy, we also experienced an increase in the quoted rental rate. Now at $17.30 per square-foot, this is $0.04 higher than last quarter and only $0.03 less than the recent record high of $17.33 we saw in Q1 2016.

vacant-space-and-quoted-rental-rate-q3-office

Our Summary/Analysis:

All in all, Q3 brought positive news for Central Pennsylvania’s office real estate market. An increase in demand for space is driving down vacancy and driving up the price per square foot. New properties are at least 50%, if not 100%, preleased before they even hit the market. With another 100% preleased property expected to be delivered next quarter, we predict that 2016 will have a strong finish, indicating a healthy and growing office market.

Based upon the data for Q3 2016, what do you find to be most interesting or important? Share your insight by commenting below!

[Online Resources] Real Estate, analysis, business, buy, camp hill, central pa, Commercial Real Estate, Construction, cumberland, dauphin, demand, Economy, harrisburg, hershey, lancaster, lease, local, market, mechanicsburg, Mike Kushner, net absorption, new, office, Omni Realty, pennsylvania, property, rent, report, sales, space, trends, york

Median Household Incomes Mostly on the Rise for Central Pennsylvania

Posted on September 26, 2016 by Mike Kushner in Blog, Local Market, Trends No Comments

According to the data from the U.S. Census American Community Survey, released on September 15, Central Pennsylvania is following in suit with greater Philadelphia – and the rest of the nation – which is experiencing an increase in median household incomes. Taking into consideration Cumberland, Dauphin, Lancaster, Lebanon and York Counties, here are some of the most notable trends published in the report.

The highest median household income is Cumberland County at $63,890; in contrast, the lowest median household income is Lebanon County at $52,571. Lancaster County increased the most in the last year, by $1,859. Decreasing the most was Lebanon County, by $1,497.

Lancaster County has the lowest median income for Black or African American households at $32,445. While the lowest median income for Hispanic or Latino households is Lebanon County at $25,422. The greatest difference in median income between male versus female householder (with no spouse present) is $18,429 in Cumberland County.

For all counties, the highest median income was for householders between the ages of 45 to 64 years old and for households of married couple families. Also, female householders (with no spouse present) always earned less than male householders (with no spouse present).

If you’re curious what other trends emerged and what these trends tell us about the health of our local economy, let’s take a closer look at each county’s specific numbers.

Cumberland County, Pennsylvania

The 2016 median household income in Cumberland County is $63,890. This number is up from $62,759 in 2014 and is the highest median income we have seen this decade. For householders between the ages of 45 to 64 years old, the median income rises to $78,960. Households of married couple families have the highest median income at $87,714. A male householder with no wife present has a median income of $54,837. In contrast, a female householder with no husband present has a median income of just $36,408. Black or African American households had a median income of $32,661 and Hispanic or Latino households had a median income of $35,097.

Dauphin County, Pennsylvania

The 2016 median household income in Dauphin County is $54,232. Up from $52,975 in 2014, this number has been on an almost steady rise for the last decade. For householders between the ages of 45 to 64 years old, the median income rises to $63,373. Households of married couple families have the highest median income at $79,328. A male householder with no wife present has a median income of $46,430. In contrast, a female householder with no husband present has a median income of just $35,520. Black or African American households had a median income of $37,823 and Hispanic or Latino households had a median income of $33,947.

Lancaster County Pennsylvania

The 2016 median household income in Lancaster County is $59,262. This county experienced the greatest increase in the Central PA region over the last year. Rising from $57,403 by $1,859, this is also the highest number we have seen this decade, which is especially notable since median income took a dip in 2010, falling to $51,740.

For householders between the ages of 45 to 64 years old, the median income rises to $73,155. Households of married couple families have the highest median income at $78,218. A male householder with no wife present has a median income of $47,391. In contrast, a female householder with no husband present has a median income of just $36,925. Black or African American households had a median income of $32,445 and Hispanic or Latino households had a median income of $38,125.

Lebanon County Pennsylvania

The 2016 median household income in Lebanon County is $52,571. Down from 2014’s median income of $54,068, Lebanon County experienced several ups and downs throughout the past decade. For householders between the ages of 45 to 64 years old, the median income rises to $60,578. Households of married couple families have the highest median income at $73,219. A male householder with no wife present has a median income of $44,239. In contrast, a female householder with no husband present has a median income of just $34,383. Black or African American households had a median income of $34,662 and Hispanic or Latino households had a median income of $25,422.

York County, Pennsylvania

The 2016 median household income in York County is $58,409. This was another Central PA county that decreased since 2014, though ever so slightly by just $178 ($58,587 in 2014). With several ups and downs in median income, the number has still mostly been on the rise over the past decade.

For householders between the ages of 45 to 64 years old, the median income rises to $72,004. Households of married couple families have the highest median income at $81,711. A male householder with no wife present has a median income of $46,681. In contrast, a female householder with no husband present has a median income of just $33,911. Black or African American households had a median income of $44,525 and Hispanic or Latino households had a median income of $33,182

Our Analysis

Increasing median household income is just one trend that affects commercial real estate. The local employment gains continue to be strong, with seasonally adjusted unemployment rate holding below 5.0 percent. This adds to the demand for housing in a variety of forms: for office space, for the retail sector and for industrial/distribution facilities.

Underlying inflation is extremely tame, providing no impetus for significantly higher rates. Lending rates and fixed income rates of return will remain low by historical standards. For most metro areas (including Central Pennsylvania) and property types, lower oil prices have been a net positive. Spending less on gasoline encourages consumers to spend more on other items, which helps retail and hotel market fundamentals.

Lower prices directly translate into an increase in household disposable income. Overall, the commercial property market in 2017 will continue to be characterized by strong fundamentals, increased investor flows and high transaction volume.

What median income was most surprising to you? What do you think some these trends say about the health of our local economy? Share your thoughts by commenting below!

[Online Resources] Real Estate, analysis, average, budget, central pa, central pennsylvania, commercial, data, debt, facts, income, market, median, Mike Kushner, money, news, Omni Realty Group, pennsylvania, people, poverty, prediction, report, statistics, stats, trends

Central Pennsylvania’s Retail Real Estate Market Experiences Record-Setting Quarter

Posted on September 15, 2016 by Mike Kushner in Blog, Local Market, Trends No Comments

This quarter has posted some of the highest and lowest numbers we have seen since 2012. In Central Pennsylvania’s local retail real estate market, vacancy rate is low, rental rate is high and both net absorption and total RBA have increased. But overall, what does this tell us about the state of our economy and what we can expect in future quarters?

Let’s take a closer look at some of the record-setting numbers we experienced in Central Pennsylvania’s retail real estate market in 2016’s second quarter and what they mean to the health of the economy.

Select Year-to-Date Deliveries:

Coming in at number three on the list of select year-to-date deliveries is the retail property located at I-81 and Walker Road in Chambersburg. Phase I and II, delivered in Q1 2016, total 109,237 square-feet of space that is 92% leased (44,000 square-feet with 4,400 square-feet vacant). Some of the major tenants include Kohl’s, Target, Giant, Red Robin, Staples, PetSmart, Michael’s, Olive Garden, VisionWorks, ATT&T and many more. Palisades Development, LLC are currently processing LOIs for the remaining space. Phase III is planned and construction will proceed when leasing warrants.

At number 15 on CoStar’s list, is another Palisades Development, LCC retail property located at 968 Norland Avenue in Chambersburg. This 10,800 square-foot building is 100% occupied and was also delivered in Q1 2016.

Select Top Retail Leases:

On the list of Select Top Retail Leases, Harrisburg area east claimed the top spot. Listed at number one is the Harrisburg East Shopping Center with 69,954 square-feet of space. Although not listed by CoStar’s as a “Select Top Retail Lease” for this quarter, plans are in place for the Giant currently in Colonial Commons, to make a move 0.2 miles down Jonestown Road to the Harrisburg East Shopping Center into the retail space formerly occupied by Gander Mountain. This will provide more space for Giant and is already attracting additional retail businesses nearby including a CVS Pharmacy and potentially a fast-casual restaurant, reports KIMCO, owner of the shopping center.

Select Top Sales:

Only one of the nine Select Top Sales from April 2015-June 2016 is from the Central Pennsylvania submarket. The Shoppes at Susquehanna Marketplace sold for $44,000,000 to Clarion Partners. With an RBA of 110,365 square-feet, this came at a cost of $398.68 per square foot.

Additionally, the West Porte Center, listed by CoStar as a Select Top Retail Lease, is more accurately represented as a sale. PennDOT purchased 67,126 square-feet of land for a new Amtrak station in Middletown that is expected to be finished in 2018. This is estimated to be a $32 million project which will include features like a covered pedestrian bridge to provide direct access to Penn State Harrisburg’s campus.

Absorption and Demand:

Net absorption increased this quarter from 64,467 square-feet (in Q1) to 110,449 square-feet, currently. Total RBA also increased, though just slightly, from 88,822,714 square-feet (in Q1) to 88,854,312 square-feet, currently. Six buildings were delivered with a total RBA of 31,598 square-feet. Additionally, five buildings are under construction.

deliveries-absorptiona-and-vacancy

Vacancy:

This quarter, the vacancy rate decreased by 0.1% to 4.7%. This once again matches the vacancy rate of Q4 2015, which is the lowest rate the Central PA submarket has experienced since prior to Q3 2012.

Rental Rate:

The quoted rental rate increased this quarter by $0.11 to $12.00. This is the highest price per square-foot the local retail real estate market has experienced since prior to Q3 2012.

vacant-space-and-quoted-rental-rate

Our Summary/Analysis:

Q2 2016 provided to be an exciting and record-setting quarter for Central Pennsylvania’s retail real estate market. We experienced a recent record low for vacancy rate at 4.7% and a recent record high for quoted rental rate at $12.00 per square-foot. These two trends go hand in hand, so it’s no surprise they would correlate together.

Another positive indicator for the health of the retail real estate market is the increase in net absorption and total RBA. Though neither were record-setting per se, net absorption nearly doubled in a single quarter which is impressive in its own right. It’s safe to say that the market is growing in demand, increasing in price and is able to absorb the new buildings that have been delivered.

What trend do you think will have the greatest impact on the Central Pennsylvania retail market? Share your insight by commenting below!

[Online Resources] Real Estate, 2016, advice, analysis, blog, building, business, buy, commercial, Construction, costar, data, Economy, expert, facts, growth, lease, market report, Mike Kushner, new, news, numbers, Omni Realty, opinion, prediction, project, q2, retail, sale, second quarter, sell, space, statistics, store, trends

New Industrial Space Popping Up All Over Central PA While Vacancy and Rental Rates Increase

Posted on August 14, 2016 by Mike Kushner in Blog, Local Market, Trends No Comments

The Central Pennsylvania industrial real estate market is an active place to be right now! In second quarter 2016, three new properties were delivered with three more under construction. Most interestingly, none of this new space is preleased. Both vacancy and rental rates continue to rise to some of the highest numbers we have seen in recent quarters.

What do these trends tell us about the health of the industrial market and the local economy? Let’s take a closer look at the highlights from second quarter 2016.

Select Year-to-Date Deliveries:

The Lebanon Valley Distribution Center, located at 139 Fredericksburg Road, Fredericksburg was delivered this quarter with an RBA of 874,126 square-feet that is not preleased. Another Central Pennsylvania building delivered in second quarter 2016 is the property at 192 Kost Road, Carlisle. It has an RBA of 422,200 square-feet and is not preleased. Third, LogistiCenter 78-81 delivered another 405,000 square-feet of unleased space this quarter. Combined, this is 1,701,326 square feet of new, unleased industrial space delivered in second quarter 2016.

Top Under-Construction Properties:

In addition to the buildings delivered to the market this quarter, there are three more under-construction properties in Central Pennsylvania that will be delivered in the coming year. The Eden Road Logistics Center will be delivered in fourth quarter 2016. It has an RBA of 754,881 square-feet and is 0% preleased. Trade Center 44 is also expected to deliver in fourth quarter 2016. This property has an RBA of 620,000 square-feet and is 0% preleased. Finally, Crossroads Logistic Center is expected to deliver in first quarter 2017 with an RBA of 398,250 square-feet. It is also 0% preleased.

Select Top Sales:

Three of the nine Select Top Sales between April 2015 and June 2016 took place in Central Pennsylvania. Coming in at number one on the list is Park 81 in Shippensburg. This 1,495,720 square-foot facility sold for $83,000,000 to CBRE Global Investors, LTD. Number five on the list is 100 Louis Parkway in Carlisle. This 400,596 square-foot facility sold for $28,850,000 to Industrial Property Trust. The final Central Pennsylvania property on the list, ranking number seven, is located at 1225 S. Market Street, Mechanicsburg. With 596,703 square-feet, this property sold for $21,350,000 to Allen Distribution.

Absorption and Demand:

Net absorption once again dropped this quarter to 69,303 square-feet. If this trend does not soon reverse, we are inching our way closer to a negative net absorption that we have not seen since second quarter 2013. Net absorption has been declining each quarter since reaching a peak of 2,382,561 square-feet in second quarter 2015. Though this quarter was not the drastic decrease we have seen in most recent quarters, it is still contributing to the downward trend.

Deliveries, Absorption and Demand

Vacancy:

Vacancy has increased this quarter, rising to 6.0%. This is the highest vacancy rate we have seen since second quarter 2014. After reaching a low of 4.5% in second quarter 2015, vacancy has continued to rise steadily.

Rental Rate:

The quoted rental rate is also on the rise. Second quarter 2016 ended with a rate of $4.30 per square foot. This is the highest rate we have seen since prior to third quarter 2012. It was only midway through 2015 when we saw this rate exceed $4.00 and it has been steadily rising ever since.

vacant space and quoted rental rate 2

Our Summary/Analysis:

With so much new, unleased space entering the Central Pennsylvania industrial real estate market right now, it’s obvious why net absorption continues to decrease. By first quarter 2017, another three new, unleased buildings will be completed which leads us to predict that a negative net absorption in in our not too distant future. Following this trend, vacancy rates will continue to rise as well.

Where it gets interesting is even with all of this new, unleased space and vacancy rates on the rise, second quarter 2016 experienced the highest quoted rental rate we have seen in recent years. What this tell us is that the demand for industrial space in Central Pennsylvania continues to outpace supply.

In a recent Central Penn Business Journal article, many experts weigh in on the thriving industrial market. The consensus? We will continue to see growth, especially with retailers’ increased emphasis on faster home deliveries. To accomplish one-day deliveries, for example, this calls for more facilities in closer proximity.  The demand may not necessarily be for larger warehouses, but for more warehouses placed in prime locations. And Central Pennsylvania is a prime location for warehousing and distribution, indeed!

What additional impact do you think all of this new industrial space will have on the Central Pennsylvania market? Share your insight by commenting below!

[Online Resources] Real Estate, analysis, building, camp hill, carlisle, central pa, Construction, costar, data, dauphin, Economy, harrisburg, hershey, highlights, industrial, lancaster, lease, lemoyne, local, market, market report, mechanicsburg, Mike Kushner, new cumberland, numbers, Omni Realty, pennsylvania, properties, property, rate, rental cost, sales, space, statistics, trends, vacancy, york

Hundreds of Thousands of Square-Feet of New Office Space Coming to Central PA in 2016

Posted on August 1, 2016 by Mike Kushner in Blog, Local Market, Trends No Comments

Architect and foreman construction worker discussion a plan, looking blueprint on location site

Two new construction projects, located at the intersection of Carlisle Pike and Hogestown Road in Mechanicsburg, will deliver 258,000 square-feet of office space to Central Pennsylvania this year. Silver Spring Township is calling this construction “Class A Office Space Project” and are confident that, by attracting new businesses to the area, this space will benefit the entire community and its existing businesses.

Here’s a look at how the market has responded to this new space, as well as our analysis of the long-term trends that are yet to come.

Select Year-to-Date Deliveries/Top Under-Construction Properties:

In Q2 2016, Central Pennsylvania had just one building delivered, but it was substantial. Ranked number one on the Greater Philadelphia list of Year-to-Date Deliveries is the office space located at 974 Hogestown Road, Building 200, Mechanicsburg. It is Class A office space that is 100% occupied. Another 129,000 square-feet building, also located on Hogestown Road is under construction and projected to be completed in Q3 2016.

Absorption and Demand:

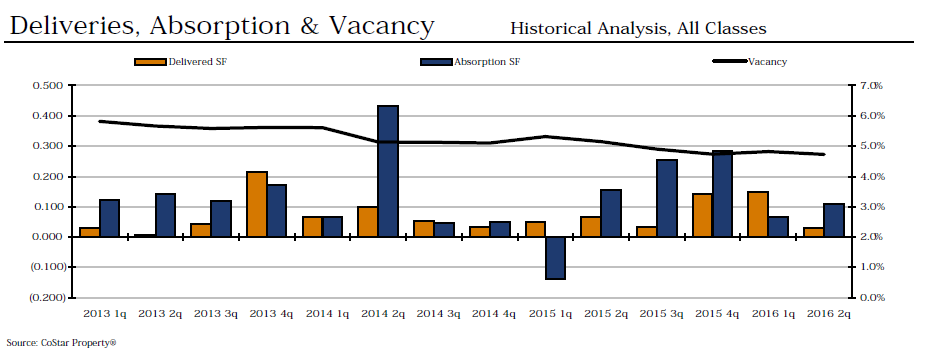
In Q2 2016, the net absorption has almost doubled since Q1 2016 and is nearly six times larger than it was in Q4 2015. In Q4 2015 it was 50,949 square-feet, increasing to 162,531 square-feet and further increasing this quarter to 301,337 square-feet. This is the largest net absorption we have seen in over a year, compounded by the fact that Central Pennsylvania’s last four years of net absorption has been varied and volatile. One new building delivered this quarter contributed 129,000 square-feet of pre-leased space to the market. There are 2 more buildings currently under construction and they are expected to deliver 136,590 square-feet of space to the market later this year.

Deliveries, Absorption and Vacancy

Vacancy:

The vacant square footage decreased from 3,705,257 square-feet (Q1) to 3,532,920 (Q2). The vacancy rate also decreased to 6.5% (down 0.3% from last quarter). This is the lowest vacancy rate we have seen since prior to Q3 2012 and is only the second time it’s dipped into the 6.0% range, with last quarter being the first time. Though the vacancy rates have bounced slightly between increasing and decreasing each quarter since 2012, the overall trend has been a decrease.

Rental Rate:

This quarter, the quoted rental rate decreased from $17.32 (Q1) to $17.25. This is the first decrease that we have seen since Q3 2013. However, the fact that the price per square foot still remains above $17.00 makes it a higher price point than the market has experienced between the years of 2012-2015.

Vacant Space and Quoted Rental Rate

Employment:

Pennsylvania’s unemployment rate rose to 5.6% in June. The local labor force declined by 4,000 from May’s record high level of 6.54 million. The Pennsylvania Department of Labor reported that nine of the 11 sectors actually posted job increases in June; however, the two sectors that posted a loss, mining and logging and trade, transportation and utilities, were enough to cause the unemployment rate to rise. They each posted job losses of 600.

Our Summary/Analysis:

Silver Spring Township’s “Class A Office Space Project” is drawing new business into Central Pennsylvania. With 129,000 square-feet of 100% occupied space delivered to the market this quarter and another building of the same size to be delivered next quarter, there is a proven demand for this space. Furthermore, this spur of activity has the potential to draw even more businesses into the area who want to be part of the growing business community. This would come at an opportune time as the local market is experiencing a rise in unemployment.

What trend this quarter do you think will have the greatest impact on the Office Real Estate market moving forward? Share your insight by commenting below!

[Online Resources] Real Estate, absorption, analysis, buildings, business, camp hill, central pennsylvania, commercial, Construction, costar, data, east shore, Economy, employment, expert, harrisburg, hershey, impact, jobs, lancaster, market report, mechanicsburg, Mike Kushner, office, Omni Realty, pa, pennsylvania, rental rate, report, space, statistics, unemployment, vacancy rate, west shore, york

Central PA Retail Market Reacts to 7 New Buildings Delivered in First Quarter 2016

Posted on June 27, 2016 by Mike Kushner in Blog, Local Market, Trends No Comments

2016 has already proven to be an interesting year for Central Pennsylvania’s retail real estate market. A total of seven new buildings were delivered this quarter alone with a combined RBA of nearly 150,000 square-feet of space – only some of which is occupied. As a result, this new space has impacted vacancy and rental rates as well as net absorption. Here is a more detailed look at some of the highlights from Q1 2016 for Central Pennsylvania retail.

Select Year-to-Date Deliveries:

Seven new buildings were delivered to the Central Pennsylvania retail market in Q1 2016. Six of these properties made it to CoStar’s list of the Philadelphia Market’s Top 15 Select Year-to-Date Deliveries. They are as follows:

  • Number 2 on CoStar’s list is the building at I-81 and Walker Road with an RBA of 109,237 square-feet that is 12% occupied.
  • Number 7 on CoStar’s list is the building at 968 Norland Avenue with an RBA of 10,500 square-feet that is 71% occupied.
  • Number 10 on CoStar’s list is the building at Cedar Crest Crossing with an RBA of 7,310 square-feet that is 100% occupied.
  • Number 11 on CoStar’s list is the building at 2101 Strickler Road with an RBA of 7,043 square-feet that is 0% occupied.
  • Number 13 on CoStar’s list is the building at Donegal Square with an RBA of 6,108 square-feet that is 0% occupied.
  • Number 15 on CoStar’s list is the Chik-Fil-A located at Chambersburg Square with an RBA of 5,000 square-feet that is 100% occupied.

Absorption and Demand:

After hitting a low of negative 152,049 square-feet in first quarter 2015, net absorption has been on a steady climb. However, this trend came to an end this quarter with a significant decrease in net absorption, dropping from 281,270 square-feet (Q4 2015) to 105,984 square-feet (Q1 2016). The seven new buildings, with a combined RBA of 149,898 square-feet, most certainly had an impact on the market’s ability to absorb the new space. It’s also worth noting that Central Pennsylvania comes in second, only behind suburban Philadelphia, in year-to-date net absorption and deliveries.

Deliveries, Absorption and Vacancy

Vacancy:

This quarter the vacancy rate barely budged, increasing from 4.8% to 4.9%. What’s worth noting is that this is one of the very few times we have seen the rate increase during a nearly four-year-long trend of decreasing rates. After hitting a high of 6.0% in the latter part of 2012, rates hit their lowest number last quarter at 4.8%. Could this quarter’s increase be the start of an ongoing trend of increasing rates? The seven new buildings delivered to the market this quarter would indicate yes, which brings us to our next area of focus.


Rental Rates:

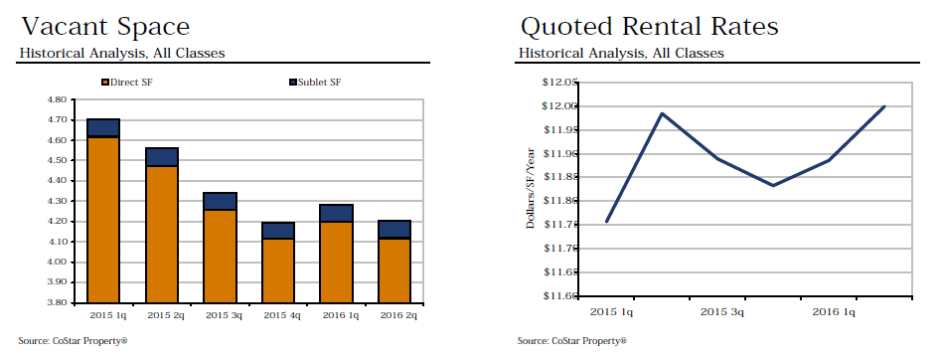
Lastly, the quoted rental rates have increased by $0.05, from $11.83 last quarter to $11.88 this quarter, returning them nearly to where they were in Q3 2015. Over the past four years, Central Pennsylvania’s rental rates for retail space have increased and decreased without much consistency. It will be interesting to watch these numbers throughout the rest of the year.

Vacant Space and Quoted Rental Rate

Our Summary/Analysis:

With nearly 150,000 square-feet of new retail space dumped into the market this quarter, Central Pennsylvania has responded to these changes well – all things considered. The vacancy rate moved just ever so slightly and rental rates actually increased, proving the market has a demand for this new space. Further proof is that Central Pennsylvania ranks second to suburban Philadelphia in year-to-date net absorption and deliveries. We should keep a keen eye on how the new construction will continue to impact our local businesses and economy as there is sure to be additional movement and emerging trends!

What trend this quarter do you find most noteworthy? Share your thoughts by commenting below!

[Online Resources] Real Estate, advice, analysis, buildings, camp hill, central pa, city, Construction, costar, cumberland, data, dauphin, expert, facts, harrisburg, hershey, lancaster, lemoyne, local, market, mechanicsburg, Mike Kushner, new cumberland, Omni Realty, opinion, pennsylvania, projects, region, report, retail, trends, york
  • 1
  • 2

Subscribe To Our Blog

Mike J Kushner, CCIM

  • Contact me for a FREE Lease Review!
  • This field is for validation purposes and should be left unchanged.

Categories

  • About Us
  • Blog
  • CCIM
  • Commercial Real Estate
  • Community
  • Construction
  • CPBJ Articles
  • CREDC Articles
  • Feature
  • Featured Opportunities
  • Guest Blogger
  • Healthcare
  • In the News
  • Industrial
  • Local Market
  • Office Leasing
  • Success Stories
  • Tenant Representative/Buyer Agent
  • Trends
National Trends

CRE Data Powered by:

CRE Data Powered by ReisReports
Vacancy Rates

Vacancy Rate Data Powered by:

Vacancy Rate Data Powered by ReisReports
Metropolitan Ranking

Vacancy Rates and Rent Growth Data Powered by:

Vacancy Rates and Rent Growth Data Powered by ReisReports

(c) 2019 OMNI REALTY GROUP- Website Design by The John Webster Company