OMNI Realty Group
  • Email
  • Facebook
  • Linkedin
  • Twitter
  • Rss
  • Home
  • Omni Advantage
    • Success Stories
    • Our Clients
    • Completed Deals
    • In the News
  • Services
  • Resources
    • Market Reports
    • Local Market
    • Office Space Calculator
    • CCIM Advantage
      • User Investment
      • CCIM Brochure
      • Total Expertise
      • Distinguish Yourself
      • How Would You Rate
  • Global Reach
  • Property Search
  • FAQ
  • Blog
  • Contact Us

Posts tagged "commercial real estate broker"

Home» Posts tagged "commercial real estate broker"

COVID-19 Prompts Manufacturing Companies to Make Long-Term Changes

Posted on October 28, 2020 by Mike Kushner in Blog, Commercial Real Estate, Industrial, Trends No Comments

According to a new study, more than 90% of companies expect the disruption of global supply chains caused by the pandemic to have long-term effects on their businesses. This has caused manufacturers to closely examine various aspects of their businesses and consider what may need to change, possibly permanently, to adjust to the new COVID-19 reality we are living in.

Furthermore, businesses have begun to realize the importance of continuously monitoring their suppliers, especially those overseas, for risks and disruptions as they try to accommodate many personnel issues, supply chain disruptions, and uncertainty in general.

Keep reading to learn what this new survey and other news sources are reporting about the change to manufacturing and supply chain businesses as the result of the pandemic, and how these changes stand to impact the commercial real estate market.

Widespread Impact in a Variety of Areas

Respondents to the survey estimated that on average about 43% of their entire supply chain suffered some kind of interruption. For the majority of respondents, this was due to fluctuation in supplier pricing and safety restrictions causing orders to be paused or slow to fill. The next most common interruption was the need to find suppliers in other geographic regions due to import/export restrictions, followed by the challenge of suppliers going bankrupt. Many manufacturing businesses didn’t experience just one of these interruptions, but a combination of several which made for an exceptionally chaotic time when COVID-19 first hit. Now that the world has gone on to accept where we are the new reality, at least for the foreseeable future, manufacturing and supply chain industries are shifting from short-term considerations to long-term changes that will make them more stable in the future to sustain a global event in the future.

What this means for commercial real estate: As businesses are reacting to the widespread impact of COVID-19 on manufacturing and supply chain operations, there is a valuable opportunity for commercial real estate owners and investors here in the United States to position their properties as solutions for addressing these changing needs. Businesses may need more space, or a different configuration of space to accommodate their new systems and processes. The more flexible CRE professionals can be with their space, the more they will be able to attract new tenants and even expand their portfolio.

Shift to Reshoring and Nearshoring

In an effort to learn from what this pandemic has already taught us, manufacturing businesses have shifted their focus toward solutions that stand to reduce risk and protect against future shocks as of the likes of COVID-19. Many businesses are taking steps toward retooling their supply chain, and one major shift in mindset is reshoring or nearshoring manufacturing that was once offshore. Reshoring is the process of bringing back overseas supply chain operations to the country of origin and nearshoring is the process of bringing supply vendors closer to the point of origin, from farther overseas destinations. Reshoring and nearshoring an operation’s most vital materials reduces the risk of being held hostage by offshore suppliers.

In that same survey, 97% of respondents said they agree that better visibility into their suppliers is imperative. When various components of a business are broken up and distributed all across the globe, it can be nearly impossible to keep your thumb on all aspects of operations and it can make it harder for these points of operations to communicate effectively with one another. Now more than ever, businesses are seeing the value of keeping their operations within the same country, if and when it’s possible.

What this means for commercial real estate: For commercial real estate owners and investors, this means the demand for industrial space is going to rise. As businesses look to retool their supply chain and bring components back to the United States, they will inevitably seek more warehousing and manufacturing space to accommodate their growing needs.

The Smartest Businesses Are Acting Now

In such a challenging environment, the most forward-thinking businesses are not wasting time addressing vulnerabilities in their supply chains. Many respondents (98%) are planning to take some kind of action to build resilience against future disruptions – and the top courses of action are identifying and employing alternative suppliers, continuous monitoring, and increasing reshoring capabilities. Additionally, diversifying or localizing supply chains are a way to reduce costs, as well as better prepare for future economic disturbances.

What this means for commercial real estate: Now is the time to position your CRE assets as solutions for manufacturing and supply chain businesses. If your space is a fit for such needs, you should market it as such. Be direct in the unique benefits your space can provide a business. For industrial businesses, this means a large and functional space located conveniently for transportation. The Central Pennsylvania region is accessible to major cities and transportation hubs on the East Coast. Commercial real estate space along the I-81 and I-83 corridors will benefit from any beefing up of supply chains and logistics in this area.

With the impact of COVID-19 causing many manufacturing businesses’ to change how and where they make, store, and transport goods, the silver lining is that the Central Pennsylvania is likely to experience an increase in demand for industrial and manufacturing space. This will in turn drive new construction, bring more jobs to the area, and strengthen the overall economy. This is not to overlook the many significant challenges the pandemic has caused to all industries, but it’s at least one path that is headed in the right direction, particularly for industrial real estate in Central PA.

Do you have a question or idea related to manufacturing, commercial real estate, and COVID-19? Join the conversation by leaving a comment below.

[Online Resources] Real Estate, agent, business, businesses, central pennsylvania, Commercial Real Estate, commercial real estate broker, commercial real estate invement, COVID, COVID-19, CRE, distribution, global, harrisburg, industrial, industrial supply chain, Mike Kushner, Omni Realty Group, onshore, overseas, pandemic, pennsylvania, processes, shipping, space, tenant representative, transportation, warehouse, warehousing

Cannabis-Friendly States Get Major Boost in Commercial Real Estate

Posted on February 25, 2020 by Mike Kushner in Blog, Commercial Real Estate, Local Market, Trends No Comments

Already there are 33 states and the District of Columbia that have legalized marijuana use in some form. Many of these states, like Pennsylvania, allow for limited medical use. According to a recent article, dispensaries in Pennsylvania have sold more than seven hundred million dollars of medical marijuana since the Commonwealth implemented the program, just under two years ago. In that time, nearly 150,000 Pennsylvanians are now certified to buy weed.

While the debate of whether to legalize marijuana – medicinal or recreational – is heated, there is one aspect of this topic that is clear. The demand for the production and sale of medical marijuana is evident, both locally and nationwide. And for cannabis-friendly states, the demand for commercial real estate is on the rise. What does this mean for commercial real estate here in PA? Let’s take a look at a few key points.

Increased Demand for Both Commercial and Residential

States where medical and recreational marijuana are legal have seen increased property demand in both the commercial and residential sectors, according to a new study by the National Association of Realtors. The study also revealed that more than a third of real estate professionals polled said they saw an increase in requests for warehouses and other properties used for storage. In the same states, up to a quarter of members said they saw a spike in demand for storefronts, and one-fifth said there was a greater demand for land. States where marijuana has been legal the longest have seen the largest impact on both commercial and residential real estate.

A Double Edge Sword for Residential Real Estate

However, the residential sector has not benefited as much as the commercial sector; in fact there have actually been a few drawbacks as buyers assess the “new normal” of living near a grow house or dispensary. While between 7% and 12% of those polled said that they had seen increases in property values near dispensaries, between 8% and 27% said they’d seen property values fall. Homeowners are still adjusting to how they feel about purchasing property near areas of marijuana growth and consumption. In states where recreational marijuana is legal, 58 to 67 percent of residential property managers have seen addendums added to leases which restrict smoking on properties. The most common issue was the smell, followed by moisture issues.

CRE Investors See This as a Big Opportunity

Cannabis investors are buying up commercial property, particularly warehouses, in states where recreational and/or medicinal cannabis use has been legalized for more than three years, which was revealed in the same NAR study referenced above. Investors realize it is important to understand the supply and demand, and the regulatory dynamic in each state. Focusing on states with higher barriers to entry makes a license more valuable and makes that real estate more valuable. In 2018, warehouse demand in states with only medical use outpaced demand in states with recreational use, 34% to 27%, respectively, according to the NAR study.

The Economic Impact in Pennsylvania

Sales and participation have ramped up significantly since the program’s inaugural year. Last February, total sales had amounted to just $132 million, per the PA Department of Health. Fast forward twelve months, and the tally has risen to $711 million. That puts the Commonwealth  at 439% sales jump from year one to year two. In a snap shot, Pennsylvania’s medical marijuana program has:

  • 287,000 people registered
  • 261,000 patients
  • 1,800 registered doctors
  • 1,300 approved doctors (practitioners)
  • 168,000 active patients (2-2.5 visits a month)
  • 4 million patient visits
  • $711 million in total sales
  • $288 million wholesale
  • $423 million in retail sales
  • $110 avg. purchase per visit
  • 22 of 25 GPs are approved
  • 15 of 25 GPs are shipping product
  • 77 dispensaries are operational

Furthermore, dispensary operators don’t seem to think we’ve reached the saturation point yet. As more licenses are made available, and whatever lie ahead for further legalization of marijuana, one things is certain. As demand increases for marijuana, so will the demand increase for commercial estate.

What’s next for marijuana in Pennsylvania?

Back in October 2019, Governor Tom Wolf came out in favor of legalizing cannabis for recreational use. Last spring, a Franklin & Marshall College Poll showed that 59 percent, or nearly seven in 10 voters, support the idea of legalizing marijuana. But voter support alone is not enough. The legislation will have to pass both the House and the Senate, with much opposition particularly from the Republican Party.

While this doesn’t mean the possibility of someday legalizing recreational marijuana in Pennsylvania is off the table, it does mean there will be many hoops to jump through – just as there was for the legalization of medicinal use. Looking at the issue solely from an economic standpoint, there is much to be gained by continuing to open this market and remove barriers; however there are many other issues to consider.

Given the boost this has brought to commercial real estate, with the demand for more industrial and retail space, combined with more interest from CRE and cannabis investors, it’s wise to continue to watch for trends – both negative and positive. Looking to other states as examples also gives us insight into what to expect as the cannabis market in Pennsylvania grows, and how CRE professionals can continue to capitalize on the opportunity.

Do you agree with these trends and insights? Or do you have another viewpoint to share? Join in the conversation by leaving a comment below.

[Online Resources] Real Estate, blog, buyers agent, camp hill, cannabis, carlisle, central pennsylvania, Commercial Real Estate, commercial real estate agent, commercial real estate broker, CRE, demand, Economy, growth, harrisburg, industrial, lancaster, lebanon, legalization, lemoyne, marijuana, mechanicsburg, medical marijuana, Mike Kushner, new cumberland, office, Omni Realty Group, pennsylvania, retail, space, tenant representative, trends, york

The Red Flags of an Unfavorable Commercial Real Estate Lease

Posted on September 9, 2019 by Mike Kushner in Blog, Commercial Real Estate, Tenant Representative/Buyer Agent No Comments

As a tenant needing commercial real estate space to run your business, it can be challenging to navigate the many twists and turns of finding the right space and entering into a favorable lease agreement. Your lease with your landlord can have a large impact on the success of your business, or it could cause many headaches. To ensure you’re entering into a fair and favorable agreement, let’s look at some of the most common red flags that can pop up in a commercial real estate lease.

Term of Lease – One of the most important pieces in a commercial real estate lease, short of the price, is the duration of the lease and how it’s structured. You want to be sure you fully understand when your lease begins and when it ends, especially when the landlord is making improvements to the space.  A landlord may provide more favorable pricing or terms when entering into a lease that has a longer duration. While this is helpful from a budget perspective, be sure you feel confident that you will want to stay in this space for that amount of time.

Lease Renewal – Another possible red flag in a commercial real estate lease is when and how the lease will renew. When your current lease comes to an end, a landlord may desire the lease to auto-renew. As a tenant, you will want to be aware of this well in advance so that if you do not want to renew your lease you have options to exit the lease. Additionally, look to see if the lease specifies a change in price upon renewal. Sometimes there will be an increase that could hit you unexpectedly.

Lease Termination – Next, be sure you know the terms and penalties for breaking a lease. While it may not be your intentions to break the lease early, various factors impacting your need for the space could make it necessary. If the Lease imposes a steep monetary penalty for breaking the lease early, you may wish to negotiate that down to more favorable (and reasonable) terms.

Environmental Considerations – Some commercial real estate leases may specify that a tenant may not store any hazardous materials on the premises. This is not typically an issue; however, you will want to be sure that included in the lease is a warranty from the landlord that the premises are free of such hazardous materials. In a situation where you plan to use the commercial space (such as a warehouse) for storage of consumables (i.e., food and drinks), you may want assurance that your inventory is not likely to be contaminated.

Insurance – Be sure to check the required minimum coverages for a tenant’s liability insurance. Typical coverage minimums are $1 million per occurrence and $3 million in the aggregate. If the lease specifies higher minimums at a price that is concerning, you will want to make this part of your negotiations before signing the lease.

Maintenance – A commercial real estate lease should outline who is responsible for the repairs and maintenance of all building systems, including HVAC, electrical and plumbing. Should the lease place the responsibility on the tenant, you may wish to renegotiate this. In a situation where the tenant is only leasing a small percentage of the overall building space, it’s unusual for the tenant to assume the costs of repair and maintenance for things that impact more than their rented space.

Defaulting – Closely review the language in the lease regarding missed or delayed rent payments. It is reasonable to request at least one written notice during any 12-month period (to account for a reasonable mistake), as well as a 5-day grace period for rent payments.

Relocation – Some commercial real estate leases may include a section about relocation. Does this grant the landlord the right to relocate the tenant? Under what terms? Pay attention to this piece as it could greatly inconvenience you, if it ever takes place.

While this is by no means an exhaustive list of red flags of which you must be aware when entering a commercial real estate lease, this should provide a great starting point. What’s most important is to review every document closely, ask for clarification, and seek professional tenant representation early in the process. Having an exclusive tenant representative on your side will provide an added layer of knowledge, experience, and protection that will put you in the best position to negotiate a fair and favorable lease.

Do you have a question related to your commercial real estate lease? Reach out to Omni Realty today so we can help you find an answer!

broker, buyers agent, central pennsylvania, commercial lease, Commercial Real Estate, commercial real estate broker, commercial real estate lease, CRE, danger, industrial, landlord, lease, Mike Kushner, negotiation, office, office lease, Office Space, Omni Realty Group, pennsylvania, real estate broker, red flags, retail, tenant, tenant representative, warning signs

Tips for Promoting Your Commercial Real Estate Business on Social Media

Posted on July 22, 2019 by Mike Kushner in Blog, Commercial Real Estate No Comments

Businesses in every industry have turned to social media as a marketing tool to share information, grow their band and cultivate an audience. While in many cases, this has proven successful, there are plenty of businesses who miss the mark, and wind up disappointed when their social media strategy fails to deliver its intended results.

For commercial real estate professionals, social media can be a highly valuable tool, but only when used correctly – and consistently. Take a look as we discuss five important points for using social media to promote your commercial real estate business – or any business.

Brand yourself as a thought leader.

We all have to start somewhere. The same is true for building your online brand. Who are you going to be? Your content, and how you share it, will have a profound impact on the answer to this question. In business, I would think most of us want to be branded as a thought leader in our industry. In commercial real estate, you can achieve this by sharing expertise on technical topics, offer an analysis of data and trends, and partake in thought-provoking discussion. One of the most powerful platforms for this is Linkedin. Here, you can use your profile to reinforce your personal brand, you can share content through regular posting, and you can spark discussion in groups.

Make your content unique.

A staggering amount of content hits the internet each and every second. What’s going to make people stop and read yours? If you’re asking for someone to take time out of their day to read your words, it’s important to make them at least one, if not all four of these things: timely, importantly, relevant and interesting. For some added input, we asked John Webster, Owner of The John Webster Company and digital marketing expert.

“There is a lot of ‘noise’ on social media so your content needs to stand out,” explains John. “When sharing information about available properties do not simply inform about the property (everyone does that) take an additional minute to describe something special about the property, who would be a good fit for the property and why this specific property caught your eye.”

Be responsive and engaging.

If you want to create a true “audience” for your business’s content on social media, you need to remain present. This means you need to check in regularly on your posts to monitor comments, and respond. People appreciate and remember a personal response. This also increase the reach of your content. Sure, it make take 15 minutes out of your day to diligently login to your various social media accounts to monitor content, and engage with other people’s content, but make it a point to do this habitually, and it will pay off greatly as you cultivate an active audience.

Share the spotlight.

Once you build a valuable platform for sharing content, whether this is on your website, blog, Linkedin, Twitter, etc., you should consider sharing the spotlight every so often with other professionals who have an interesting perspective to share. Omni Realty often features guest Q&A blogs that expand our area of expertise while growing relationships with other respected professionals. When sharing the spotlight, this also opens up the door for others to do the same. My blogs are often published by TheBrokerList, and shared on their social media, which greatly amplifies their reach.

Build relationships with media.

Most people view the media as a tool, or approach outlets in a very self-serving manner. While, yes, at the end of the day promotion is an objective, you must also work to forge trust, respect, and even friendship with reporters and editors. Omni Realty has received a lot of earned media by approaching local media outlets in this manner. Through relationships with reporters, I’ve had 25+ articles featured in the Central Penn Business Journal, and none of it was paid placement.

Whether it’s a commercial real estate business, or any business that you’re trying to promote on social media, the most important thing to keep in mind is that your content creates your brand. What you share, how often, and how you engage with your audience, will leave a lasting impact and frame how people view both you and your business.

How have you found success when promoting your business on social media? Share a tip or personal story by leaving a comment below.
[Online Resources] Real Estate, agent, blog, blogging, branding, broker, buyers agent, carlisle, central pa, Commercial Real Estate, commercial real estate broker, communications, digital marketing, Facebook, harrisburg, hershey, investor, lancaster, lemoyne, LinkedIn, marketing, mechanicsburg, Mike Kushner, Omni Realty, Omni Realty Group, pennsylvania, real estate broker, Social Media, strategic communications, tenant representative, twitter, york

Power Landlords Part II: Who Owns the Most Industrial Space in Central PA?

Posted on July 8, 2019 by Mike Kushner in Blog, Industrial, Local Market No Comments

You might think that Central Pennsylvania is defined by its natural resources or agriculture, or maybe you don’t think we’re known for much of anything. The truth is that there is a lot this region brings to the economy with our industrial market being one of the country’s top core industrial markets.

If this surprises you, consider the following. This particular region is well positioned along the nationally-recognized I-81 transportation corridor with immediate connections to I-78, I-76, I-83 and I-80, as well as immediate access to major deep-water ports at New York/New Jersey, Philadelphia and Baltimore. With our ability to provide manufacturers and distributors access to nearly 70% of the total consumer markets in North America within one day’s drive, the region has benefitted from significant demand, especially most recently with the emergence of the e-commerce which promises customers even faster ship times.

Additionally, nearly 8 million square feet of new Class A regional and super regional distribution facilities are under construction. Even with this much new space entering the market, vacancy rates remain right around 5% which is well below the historical market standard of 7%. Combine all of this with a backlog of millions of square feet of new tenant requirements in the market, and you can see why Central PA’s industrial real estate market is ripe for opportunity among investors and landlords.

So, who owns the most industrial space in the market? The combined square footage of the top 5 landlords in Central PA is 32,820,237 square-feet of space. Moreover, the combined vacant square-footage for all of this space is just 2,448,898 square-feet or 7%. So, who are these power landlords and what buildings account for most of this space? Let’s take a deeper dive.

  1. Prologis Inc.

It should come at no surprise that Prologis Inc. tops this list with its portfolio of 22 industrial buildings. Combined, this accounts for 11,242,938 square-feet of real estate. The largest building, which is Key Logistics Park located at 950 Centerville Road in Newville, is home to 1,170,000 square-feet of industrial space.

  1. Global Logistics Properties, Ltd. (GIC Real Estate)

Next on the list is Global Logistics Properties, Ltd. with 19 buildings and 7,075,922 square-feet of real estate. The largest of these buildings is Lemoyne Industrial Park located at 221. S. 10th Street in Lemoyne which is 885,802 square-feet of industrial space.

  1. Clarion Partners

With 10 buildings totaling 5,676,191 square-feet, Clarion Partners ranks number three on our list of “Power Landlords” in Central PA. Their largest building, located at 1 True Temper Drive in Carlisle, is 1,226,525 square-feet in size.

  1. First Industrial Realty Trust, Inc.

At number four we have First Industrial Realty Trust, Inc. Their portfolio of 15 buildings accounts for 4,804,210 square-feet of industrial real estate. The largest building, 1,100,000 square-feet in size, is located at 5197 Commerce Drive in York.

  1. Liberty Property Trust

Coming in at number five on the list is Liberty Property Trust with 7 buildings totaling 4,020,976 square-feet of industrial space in the Central PA region. Their largest building, which is the Carlisle Distribution Center located at 40 Logistics Drive in Carlisle, is 972,000 square-feet.

It can be hard to wrap your head around these numbers and the amount of industrial space that is located right here in Central PA. Often, these are huge buildings we drive by daily but fail to notice unless we pay attention. The products that are made in and shipped from these facilities impact the global economy and provide us with every item imaginable, from basic essentials to toys and tools to match a wide variety of hobbies. So the next time you drive by the Key Logistics Park in Newville or the Carlisle Distribution Center, you now have a little more intel into who the power landlords are behind these massive facilities.

[Online Resources] Real Estate, camp hill, carlisle, central pa, clarion partners, Commercial Real Estate, commercial real estate broker, commercial real estate investor, CRE, development, distribution, Economy, facility, first industrial realty trust, global logistics properties, growth, harrisburg, industrial, industrial space, lancaster, landlord, lemoyne, liberty property, mechanicsburg, omni realty groups, pennsylvania, prologis, tenant representative, warehouse, york

Central PA Office Submarkets End Quarter with Very Different Outcomes

Posted on November 8, 2018 by Mike Kushner in Blog, Local Market, Trends No Comments

Lancaster closes Q3 with the strongest market while Harrisburg West shows signs of distress.

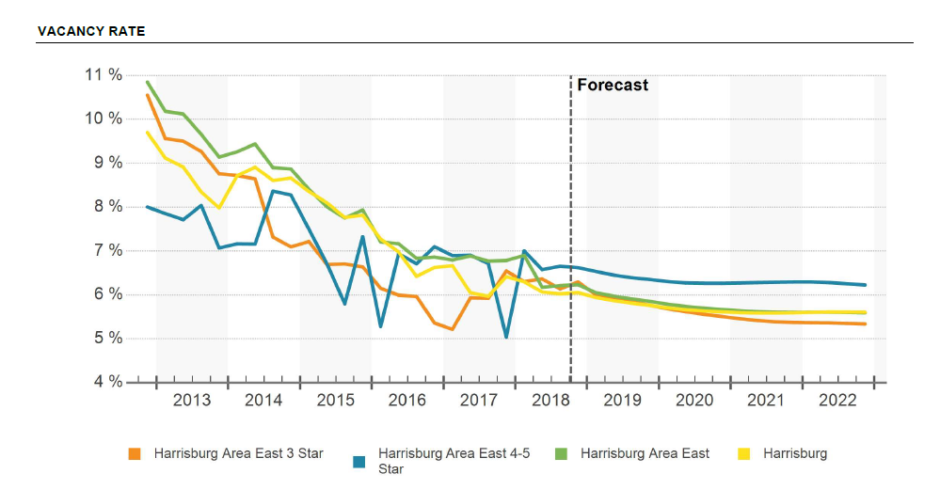
The submarkets that make up Central Pennsylvania’s office real estate market each have unique advantages and disadvantages that really show through when you examine each individually. With the close of the third-quarter, we took a closer look at how the four main submarkets performed individually and comparatively.

The outcomes should surprise you! You may think you know which of the four submarkets outperformed the others, which one is most likely in distress and the others that are sitting pretty stagnant right now. But you’ll likely be shocked by the large variances in numbers, especially when compared to the historical averages and forecasted averages of what is yet to come.

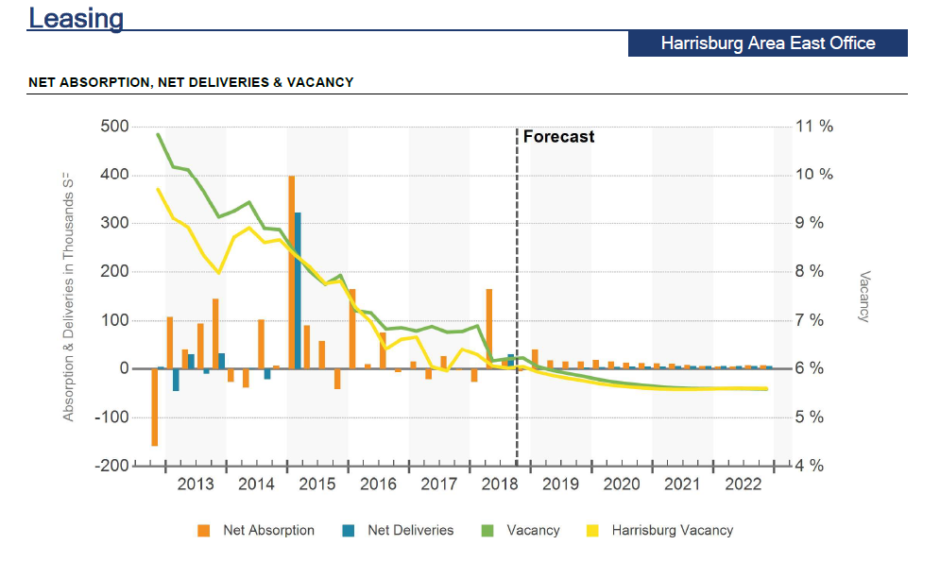
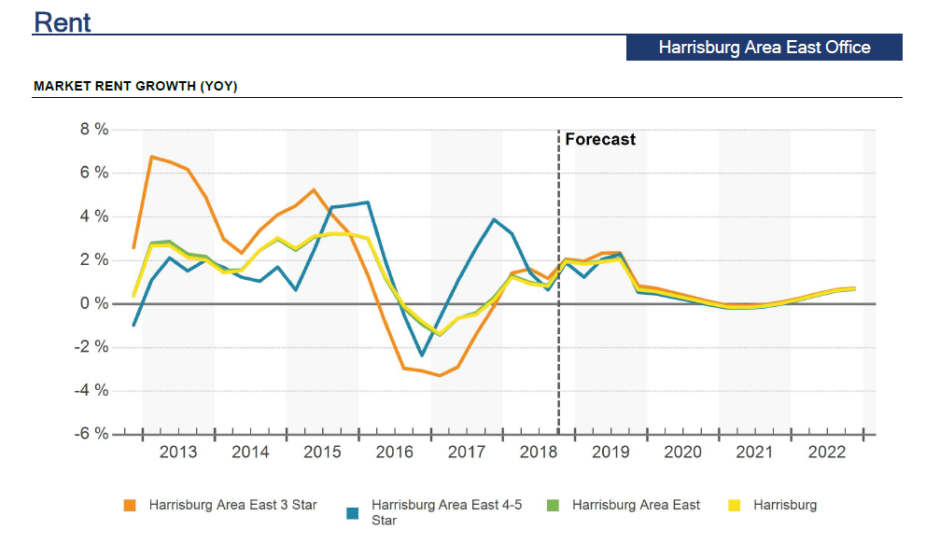
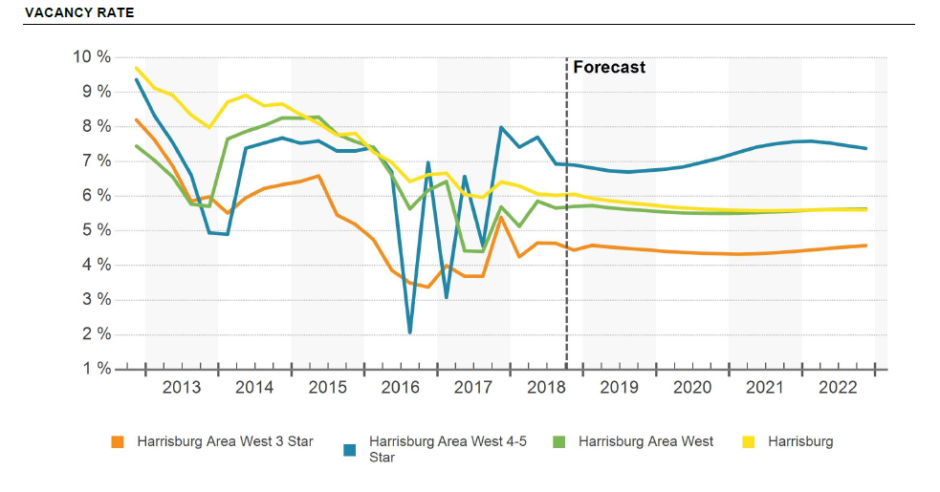
Let’s take a closer look at some of the most interesting trends and numbers reported from CoStar’s Q3 2018 office report for Harrisburg East, Harrisburg West, Lancaster and York.

Harrisburg East

Vacancy – The vacancy rate for Q3 2018 in the Harrisburg East submarket is 6.4%. This is notably lower than the historical average of 7.8% and the forecast average shows this dipping lower to 5.7%. For comparison, the peak in vacancy rate occurred in Q4 2012 when it reached 10.8% and the trough was in Q4 1997 when it plummeted to 3.1%.

12 Month Net Absorption in SF – The twelve-month net absorption is 106,000 square-feet. While this is still lower than the historical average of 187,046 square-feet, the forecast average predicts the current net absorption will fall significantly to 61,648 square-feet. Though not by much, net absorption will at least remain in the black for now.

Rent Growth – The current 12 month rent growth is 2.0%. This is higher than the historical average of 1.4%, though the forecast average predicts that this will fall to 0.7%. For comparison, the peak in Harrisburg East’s rent growth occurred in Q1 2001 when it reached 8.3% and the trough was in Q4 2009 when it plummeted to -2.4%.

12 month deliveries in SF – Harrisburg East has a twelve-month delivery of 30,000 square-feet. This takes into account all of the deliveries that occurred over the last year; however no new buildings were delivered specifically in Q3 2018. Additionally, 20,000 square-feet of 4 and 5 star office space is under construction, which will be delivered in coming quarters.

Harrisburg West

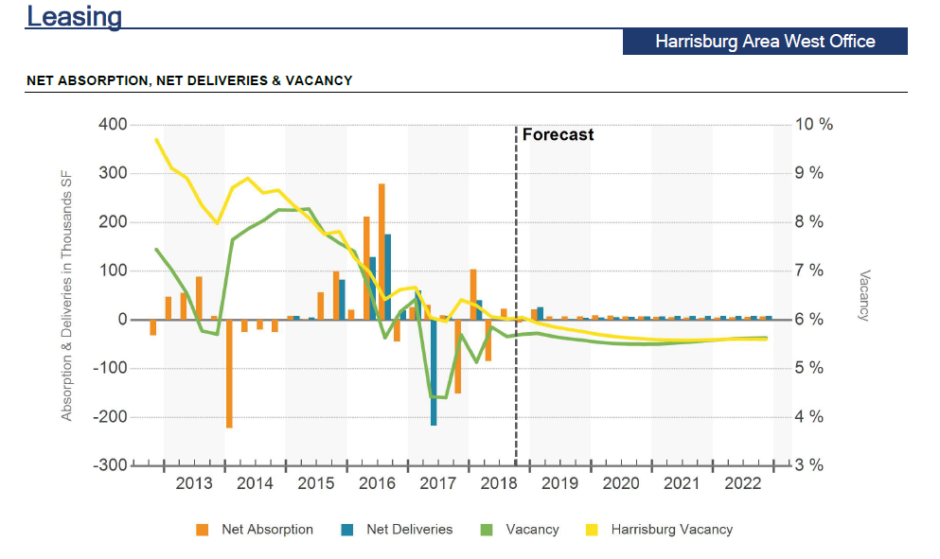
Vacancy – The vacancy rate for Q3 2018 in the Harrisburg West submarket is 7.3%. This is slightly higher than the historical average of 7.0%; however, CoStar’s forecast average predicts this to dip to 5.6%. For comparison, the peak in vacancy rate occurred in Q2 2002 when it reached 9.8% and the trough was in Q4 1997 when it plummeted to 2.5%.

12 Month Net Absorption in SF – The twelve-month net absorption is negative 258,000 square-feet. The historical average is 95,454 square-feet and the forecast average predicts the market will again return to positive numbers with 25,193 square-feet. Q3 net absorption is not far from where it was in Q4 2014 when it was negative w 292,042 square-feet. Since then, it peaked in Q3 2016 at 611,057 square-feet before falling substantially to its current negative state.

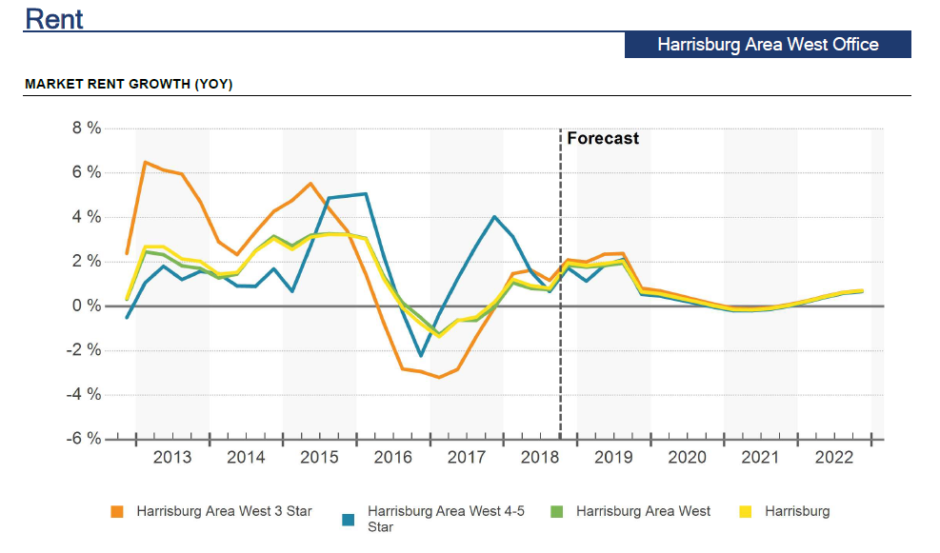
Rent Growth – The current 12 month rent growth is 1.9%. This is higher than the historical average of 1.4%, though the forecast average predicts that this will fall to 0.6%. For comparison, the peak in Harrisburg West’s rent growth occurred in Q3 2000 when it reached 7.1% and the trough was in Q4 2009 when it plummeted to -2.8%.

12 month deliveries in SF – Harrisburg West has a twelve-month delivery of 40,000 square-feet, compared to the historical average of 127,660 square-feet. This takes into account all of the deliveries that occurred over the last year; however no new buildings were delivered specifically in Q3 2018. Additionally, 26,400 square-feet of 3 star office space is under construction, which will be delivered in coming quarters.

Lancaster

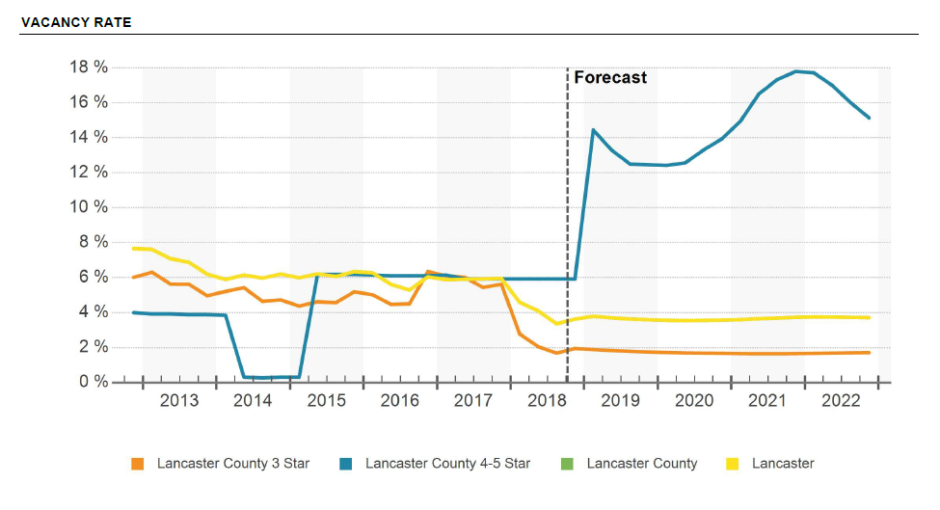
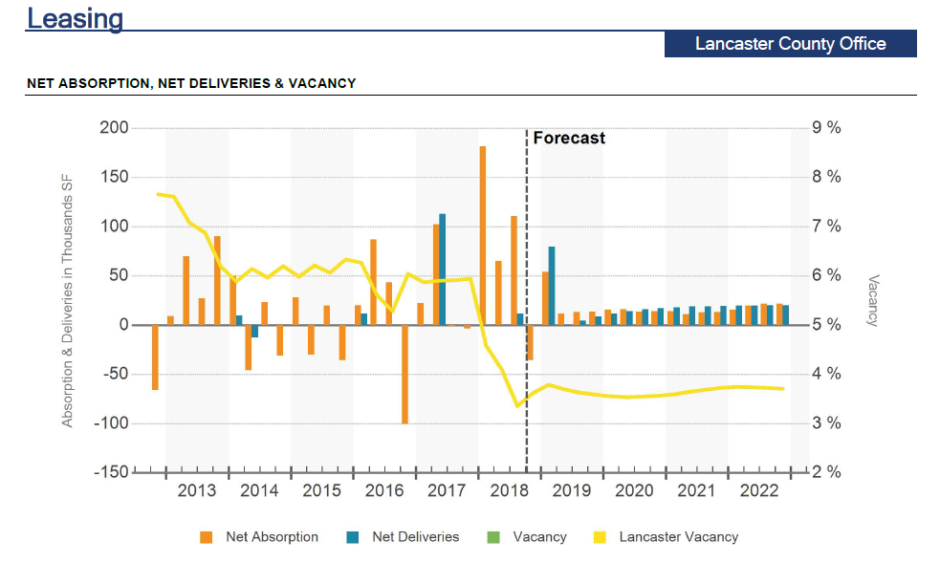
Vacancy – The vacancy rate for Q3 2018 in the Lancaster submarket is 3.6%. This is notably lower than the historical average of 6.8%; the forecast average predicts this remain fairly stable at 3.7%. For comparison, the peak in vacancy rate occurred in Q4 2004 when it reached 9.7%. The lowest the vacancy rate has ever been in Lancaster County is actually right now, in Q3 2018.

12 Month Net Absorption in SF – The twelve-month net absorption is 324,000 square-feet. The historical average is substantially lower than what it is currently and that is 109,103 square-feet. The forecast average predicts net absorption will decrease to 89,086 square-feet.

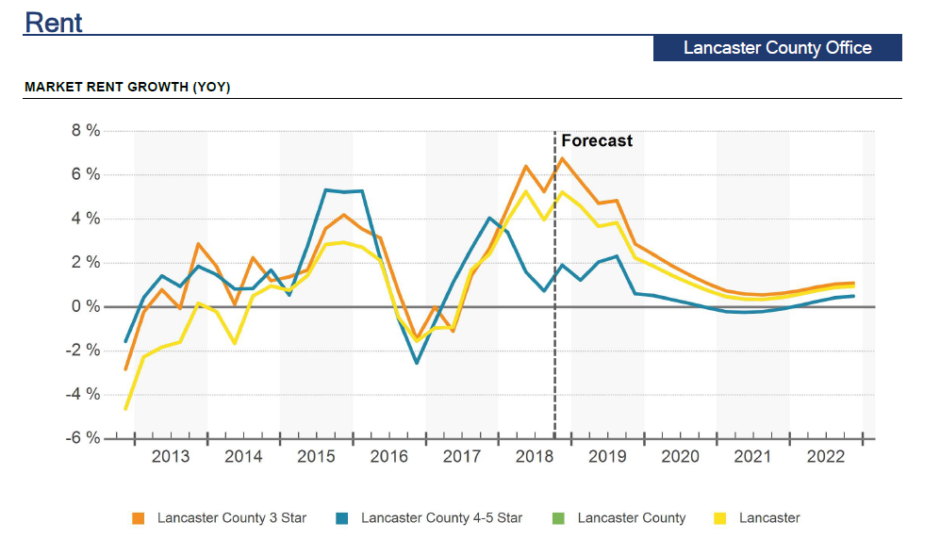
Rent Growth – The current 12 month rent growth is 4.9%. This is significantly higher than the historical average of 1.3%, though the forecast average predicts that this will fall to 1.6%. For comparison, the peak in Lancaster’s rent growth occurred in Q3 2000 when it reached 6.9% and the trough was in Q4 2009 when it plummeted to -5.0%.

12 month deliveries in SF – Lancaster has a twelve-month delivery of 12,000 square-feet, compared to the historical average of 114,237 square-feet. This takes into account all of the deliveries that occurred over the last year; however no new buildings were delivered specifically in Q3 2018. Additionally, 81,840 square-feet of 4 and 5 star office space is under construction, which will be delivered in coming quarters.

York

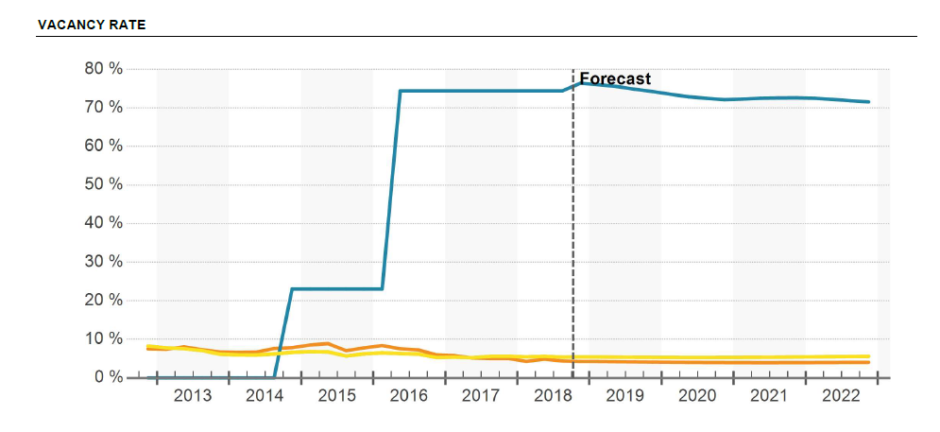
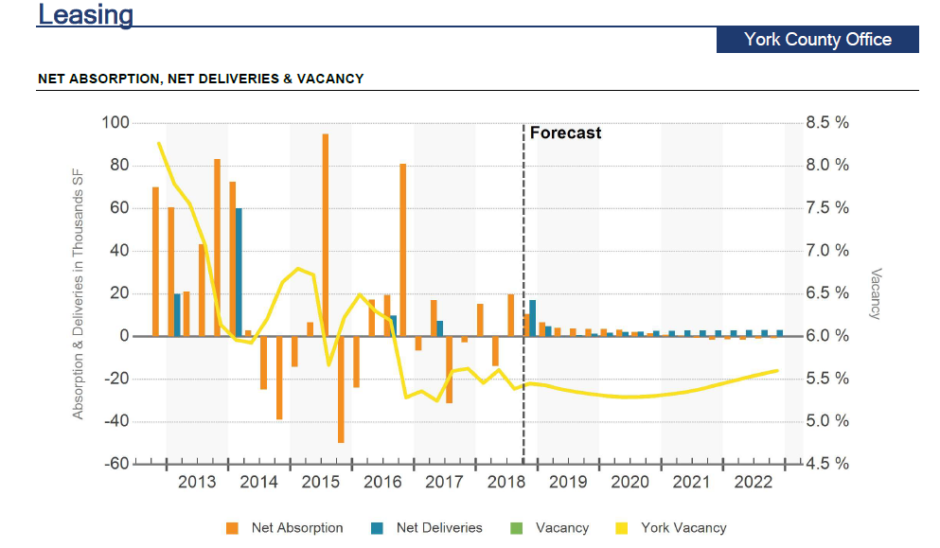
Vacancy – The vacancy rate for Q3 2018 in the York submarket is 5.3%. This is lower than the historical average of 6.9%; the forecast average predicts this remain fairly stable at 5.4%. For comparison, the peak in vacancy rate occurred in Q1 2008 when it reached 10.5%. The lowest the vacancy rate has ever been was 2.2% in Q4 1998.

12 Month Net Absorption in SF – The twelve-month net absorption is 29,500 square-feet. The historical average is 72,892 square-feet. The forecast average predicts net absorption will decrease to 8,847 square-feet.

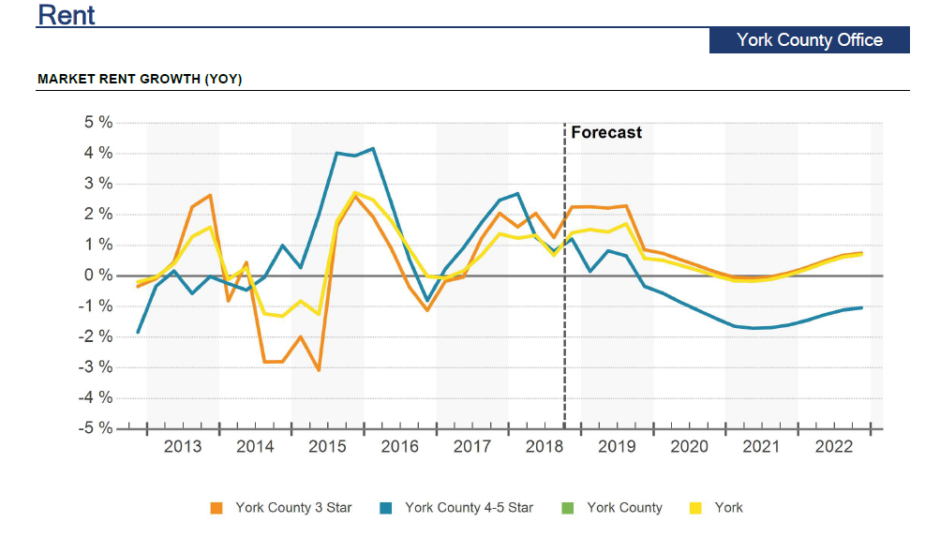
Rent Growth – The current 12 month rent growth is 1.6%. This is fairly close in line with the historical average of 1.1%, though the forecast average predicts that this will fall to 0.6%. For comparison, the peak in York’s rent growth occurred in Q3 2000 when it reached 6.8% and the trough was in Q3 2009 when it plummeted to -4.3%.

12 month deliveries in SF – York has a twelve-month delivery of 0 square-feet, compared to the historical average of 80,056 square-feet. The forecast average predicts that this rise to 13,093 square-feet. Additionally, 22,000 square-feet of office space is under construction, 17,000 square-feet of 4 and 5 star space and 5,000 square-feet of 3 star space, which will be delivered in coming quarters.

Key Takeaways

Overall, York County and Harrisburg East have been very stable. Not much is moving the needle. There is not a lot of absorption nor much new construction that could spur activity.

The real positive news from Q3 2018 is Lancaster County. This submarket rose above the rest for several reasons. First is its 324,000 square-feet in net absorption and 4.9% rent growth (highest since Q3 2003). Additionally the vacancy rate decreased 2.3%. Currently there are 81,840 square-feet under construction and 89,166 square-feet of new construction proposed.

In contrast, the Harrisburg West submarket is showing signs of distress. Its negative 282,000 square-feet of net absorption combined with a modest vacancy rate increase of 1.6% does not offer much hope for a major turnaround anytime soon. Additionally, the submarket has 86,400 square-feet of new office space under construction and 225,596 square-feet of proposed new space that the market will struggle to absorb, further driving down the net absorption.

Based on the activity taking place in Central Pennsylvania’s office real estate submarkets, how do you think this will impact business growth and development throughout these counties? How will this have a ripple effect into other areas of our economy?

Share your ideas by leaving a comment below!

[Online Resources] Real Estate, analysis, central pa, Class A, Class B, Class C, Commercial Real Estate, commercial real estate agent, commercial real estate broker, costar, east, harrisburg, lancaster, local, market, Mike Kushner, office, office real estate, Office Space, Omni Realty Group, pennsylvania, real estate agent, real estate broker, realty, report, stats, tenant representative, trends, west, york

Subscribe To Our Blog

  • This field is for validation purposes and should be left unchanged.

Mike J Kushner, CCIM

  • Contact me for a FREE Lease Review!
  • This field is for validation purposes and should be left unchanged.

Categories

  • About Us
  • Blog
  • CCIM
  • Commercial Real Estate
  • Community
  • Construction
  • CPBJ Articles
  • CREDC Articles
  • Feature
  • Featured Opportunities
  • Guest Blogger
  • Healthcare
  • In the News
  • Industrial
  • Local Market
  • Office Leasing
  • Retail
  • Success Stories
  • Tenant Representative/Buyer Agent
  • Trends

(c) 2019 OMNI REALTY GROUP- Website Design by The John Webster Company