OMNI Realty Group
  • Email
  • Facebook
  • Linkedin
  • Twitter
  • Rss
  • Home
  • Omni Advantage
    • Success Stories
    • Our Clients
    • Completed Deals
    • In the News
  • Services
  • Resources
    • Market Reports
    • Local Market
    • Office Space Calculator
    • CCIM Advantage
      • User Investment
      • CCIM Brochure
      • Total Expertise
      • Distinguish Yourself
      • How Would You Rate
  • Global Reach
  • Property Search
  • FAQ
  • Blog
  • Contact Us

Posts tagged "real estate agent"

Home» Posts tagged "real estate agent"

COVID-19 and Commercial Real Estate: Why Tenant Reps Are More Valuable than Ever

Posted on October 1, 2020 by Mike Kushner in Blog, Office Leasing, Tenant Representative/Buyer Agent No Comments

Now more than ever, if you are looking to lease commercial real estate, you need a tenant rep on your side. All of the services they provide, which include negotiations, market expertise, coordination, and strategic advice, have not changed. However, given the complexity of the during- and post-COVID economy and all of the changes that keep coming, such services have become more valuable than ever. Here are six reasons why working with a commercial real estate professional who exclusively represents is more important now than ever before.

  1. Your use of space has changed.

This spring, when basically all non-essentially businesses were forced to temporarily close or work remotely, how people used commercial spaces changed drastically. Even after people were able to slowly get back to business and reopen, there was a drastic shift in how much space was needed to accommodate needs. Some businesses decided to remain virtual and thus needed to get out of their commercial space entirely. Others needed more space or reconfiguration of space to accommodate for social distancing. Others still had to consider how they would replace communal spaces like conference rooms and kitchens.

Having a tenant rep on your side to help navigate all these changes is a huge benefit. First, they can help with lease negotiations if you need to break or change the terms of your lease. Next, they can also help you secure more or different space, if needed. Doing this on your own is a big undertaking and you don’t know what you don’t know. That’s where a tenant rep can step in to take this off your plate so you can focus on running your business.

  1. And the market has changed.

COVID turned everything on its head, which includes the commercial real estate market. It’s a new world out there, and the person who can best help you understand the changes and how they could be used to your benefit is a commercial tenant rep. It’s their job to monitor the market and help their clients adjust accordingly. With a tenant rep to guide you, the many unknowns of this market can start to make a little more sense.

  1. Getting to know a new market is challenging.

If your business needed to find a new space during the pandemic, particularly in a different city, this is where a tenant rep can really help you out. With travel restricted in so many ways, it’s virtually impossible to get to know a new market without living there or having visited it. It’s like real estate shopping with a blindfold. But when you can call upon a tenant rep who lives in your new desired market, you will benefit from all of their knowledge and expertise about that market. They can help you identify the right options for your commercial space, allow you to virtually tour it, and work on your behalf to negotiate a favorable lease.

  1. Not everything is represented online.

Another important consideration is what you see online isn’t the full picture. Many commercial properties cannot be found through an online listing. And with so many places to look, how can you be sure you didn’t overlook something. A tenant rep who knows the market knows what spaces are available, even if they’re newly listed and not represented online. They may even know of space that will soon be opening up and is not publicly known. All of this will work to your advantage to help you see your blind spots, and without having to take on the headache of this alone.

  1. Negotiation is at an all-time high.

Thanks to COVID, nothing is immune to change. This includes lease agreements. Many, many negotiations are taking place between tenants and landlords to adjust lease agreements because of the sudden change in how tenants are using (or not using) their space. A tenant rep is skilled in such negotiations and can step in on your behalf to arrive at a reasonable and favorable outcome for your lease agreement with the landlord. It also helps that they know the market and what other commercial spaces are charging per square foot and any COVID clauses that might exist.

  1. You need to protect yourself in lease agreements.

And finally, a tenant rep will be sure you are protected in your lease agreement for any future changes that might take place with your business. For example, does it make more sense for you to have a long-term or short-term contract? What should happen is you need to break the lease agreement? And what options are available to you should you need more or different space from the landlord? All of these unknowns should be addressed before you put your signature on anything and a tenant rep will be sure that all ground is covered.

Have you previously worked with a tenant rep to lease or purchase commercial real estate? If you have, what has been your experience? Do you agree that the role they play is more valuable than ever? Join the conversation by leaving a comment below.

[Online Resources] Real Estate, buyers agent, Commercial Real Estate, commercial space, CRE, industrial, investor, landlord, lease, Mike Kushner, negotiation, office, Omni Realty Group, pennsylvania, professional, real estate agent, real estate broker, retails, tenant, tenant rep, tenant representative

As Your Needs for Office Space Change, Understand the Role of a Tenant Representative

Posted on April 7, 2020 by Mike Kushner in Blog, Commercial Real Estate, Tenant Representative/Buyer Agent No Comments

The outbreak of COVID-19 hitting the United States has brought with it a tidal wave of challenges and uncertainties. This has been a wakeup call for so many businesses and individuals who must now struggle to adjust. Particularly for business owners who either own or lease commercial real estate such as a retail location, industrial space, or offices, the order to work from home and stay at home has drastically changed their need for brick and mortar space.

Whether it’s right now or once COVID-19 has passed, it’s highly likely that businesses in Pennsylvania and across our nation will have a drastic shift in their commercial real estate needs. In such times, business owners should be reminded that having a tenant representative on your side to represent you and negotiate for you as you reduce the amount of space you currently occupy, move to new office space, or change the terms of your lease is highly beneficial.

In an effort to help business owners understand how a tenant representative can be a benefit to them, and how this relationship works, we want to help answer some of the most common questions surrounding a tenant representative’s role. This first of which is “How do tenant representatives get paid?” Too often, the answer is confused with or lumped into the same category as how listing agents, who represent the landlord or seller, are compensated. But this is not necessarily the case.

What’s important to note is that exclusive tenant representatives, also called buyer’s agents, are unique in that they exclusively represent those looking to rent or buy commercial real estate. They never represent the landlord or seller, and for good reason. As you can imagine, that creates a conflict of interest which you can read more about here.

To answer the question regarding how a tenant representative/buyer agent is paid, here is a breakdown of important points to provide a clear explanation.

Typical Commission

The amount a commercial real estate agent receives on a commission is calculated as a percentage of the total commercial property sale price or lease value.  The percentages are negotiated in the listing agreement.  It’s important to note that it is illegal due to anti-trust laws to set a market or industry-wide standard for commission percentages, but on average most commissions range from 4% to 8%.

The variance in commission rates is due to a number of factors. In areas that have a surplus of office space, brokers may receive higher commission to entice tenants to particular properties. Brokers may also get varying commissions for office, retail and industrial spaces.

Co-Broke Commission – No Cost to the Tenant or Buyer

While tenant representatives/buyer agents provide their clients with incredible benefits, it’s important to note that the tenant/buyer is not responsible for a tenant representative’s/buyer agent’s fees. Properties for sale or lease that are listed with a broker specify a commission to be paid to the listing broker and shared with the broker representing the buyer/tenant. Landlords are the ones responsible for paying the fees. Most landlords have budgeted for the payment of commissions.

Although tenant reps/buyer agents are incredibly helpful for tenants/buyers looking for commercial real estate, their services also benefit landlords or their listing agent, as they help fill vacancies. Because tenant representatives/buyer agents allow listing agents to quickly turn over empty space, they are often willing to pay for their services. As a result, a buyer/renter can usually enjoy the services of a tenant representative without having to pay anything.

One caveat is that in very rare circumstances, landlords or listing agents may refuse to pay the tenant representative’s fees. Normally, this only happens when the tenant representative was not engaged from the very beginning of the tenant or buyer looking for space which can muddy the waters. This makes it all the more important to begin any commercial real estate search with a tenant representative on your team.

Advantages of Working with a Tenant Representative

If a real estate broker representing the landlord/seller encourages you to do a direct deal without a involving a tenant representative/buyer agent, proceed with extreme caution. The landlord’s/seller’s broker will likely tell you that you will save money by eliminating the tenant representative’s/buyer agent’s fees, but the truth is that the landlord/seller is likely to pay the same amount to their own representative even if you forgo a tenant rep/buyer agent. Plus, not having an agent to advocate for you during the negotiation process could mean ending up with a higher rent rate and less than favorable lease terms.

It’s important to have the knowledge and expertise of a tenant representative/buyer agent to guide you through the leasing/buying process and represent your best interests. A tenant representative/buyer agent can also make your property search less time consuming by showing you only properties that they know fit your criteria. Think of them as your tenant/buyer “concierge.”

Despite the fact that the landlord is responsible for paying the tenant rep/buyer agent, you should rest assured that the tenant representative/buyer agent is working for your best interests. This is because they don’t get paid until you find a great deal!

Has the impact of COVID-19 caused you to rethink the use of your commercial real estate spaces? If you need to downsize or renegotiate the terms of your lease, keep in mind how a tenant representative can be an advocate for your best interests.

[Online Resources] Real Estate, business, buy, buyers agent, camp hill, carlisle, central pennsylvania, Commercial Real Estate, common question, compensated, compensation, corporate, CRE, dillsburg, exclusive tenant rep, harrisburg, hershey, hummelstown, industrial, lancaster, landlord, lease, lemoyne, mechanicsburg, Mike Kushner, office, Office Space, Omni Realty Group, paid, pennsylvania, real estate agent, real estate broker, rent, retail, sell, tenant representative, york

uBreakiFix Opens New Retail Space with the Help of Omni Realty

Posted on October 2, 2019 by Mike Kushner in Blog, Commercial Real Estate, Local Market, Retail No Comments

At Omni Realty Group, it’s our passion to work with Central Pennsylvania businesses to help them find the right commercial space where they can thrive. One of our recent clients, uBreakiFix, provides a perfect example of how working with a tenant representative, like Omni, will have a big impact on the searching, negotiating, and commercial leasing process. Here’s how James McNeil, owner of uBreakiFix in Mechanicsburg came to find a new home for his business with Omni’s assistance.

About the Business

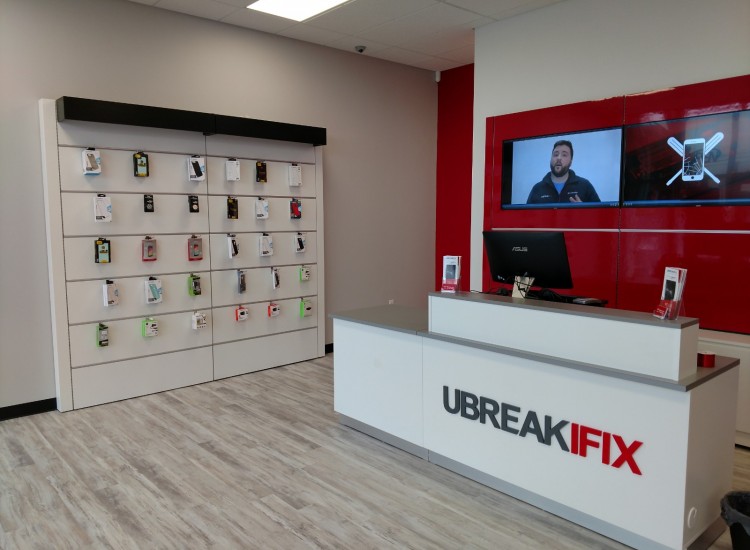
First, let’s learn a little bit more about the business and its retail needs. uBreakiFix fixes electronic devices. From the all-too-common phone drop in the parking lot to the tablet in the toilet, they’ve fixed just about every drop, slip, trip, and fumble you can envision. Those suffering the “trauma” of a broken electronic device, can walk into uBreakiFix and seek repair right on the spot – often in under one hour.

When looking for the right retail location, James knew he needed a space with high visibility and drive-by traffic. Ideally, the store would have other stores or attractions nearby where customers could browse or relax while their device was being fixed. Finally, the location needed to hit the right demographic of uBreakiFix’s target market.

Search and Struggle…then Success!

James started on his search solo. He poured hours of his time into researching possible locations. And after spending even more time touring many different properties, he came up empty handed. Fortunately, James reached out to Omni Realty Group and Mike Kushner became his tenant representative to help him in his search. Within a couple of weeks, Mike found what would become the business’s future home.

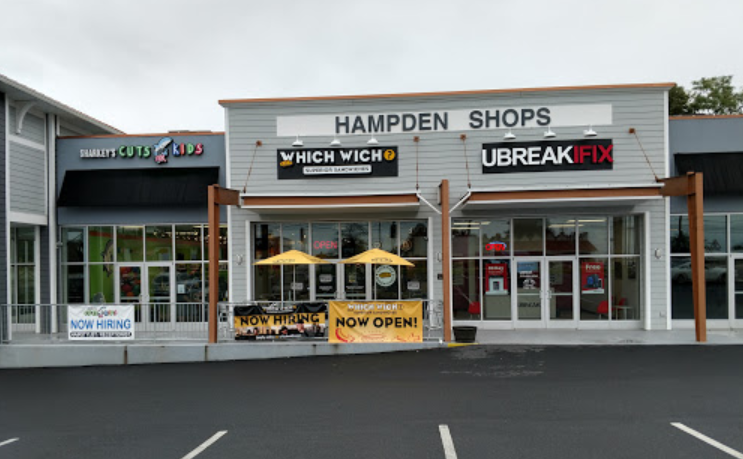
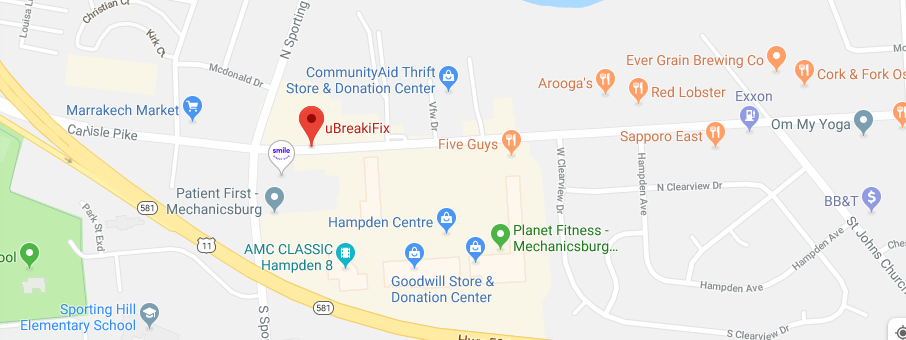
Located at 4957 Carlisle Pike, Mechanicsburg, this retail space met all of the “must haves” on James’s list. The store is part of the newly built Hampden Shops Plaza on the Carlisle Pike, one of the area’s most heavily trafficked roads for retail shopping. Within the plaza, there are places to eat, shop, get your hair cut, and much more. Rite Aid and CVS are within walking distance as well. Best of all, since it was a new space, uBreakiFix could really make it their own, by influencing the interior layout and décor.

Life Takes Compromise

The number one benefit of this space, and ultimately why James knew it was the right spot for his business, was location. It put him exactly where he wanted to be – visibility, traffic, and target market. But with anything, there was a compromise. The price point for the space was at the top of James’s budget. With Mike’s help, they negotiated this to a fair and reasonable rate that was consistent with other pricing in the area. Ultimately this was a compromise James was willing to make, considering all the other benefits of the space that would put them in the best possible position to grow.

The Difference of Having a Tent Representative

In his own words, James describes his experience working with Omni Realty Group:

“Mike did the research on the area and provided all of the relevant data to make the best decision for us. He got me in front of decision makers for the properties we look at and helped negotiate the lease payment to get the deal done. From a personal experience, it would have taken me a lot longer to find a location, as I was looking for retail space for four months, with no success, prior to working with Mike.”

Valuable Lessons Learned

If James had to go through this process again, there are valuable lesson he would apply to his next search for retail space. Here are four things he feels every business should know:

  1. Start the process with a tenant representative by your side. This alone will save you so much time, and in the end, money.
  2. Do not jump on the first option presented to you. Continue to explore even just a few more options and then fully compare pros and cons.
  3. Always negotiate.
  4. Compromise is necessary, but make sure you do not compromise on something that is most important to you.

If your business is looking for new retail, office, or industrial space in Central Pennsylvania, please reach out today so Omni Realty Group can help you like we helped uBreakiFix.

[Online Resources] Real Estate, camp hill, carlisle, carlisle pike, CCIM, central pa, Commercial Real Estate, commercial space, CRE, gettysburg, harrisburg, hershey, industrial, lancaster, lemoyne, mechanicsburg, Mike Kushner, office, Omni, Omni Realty Group, real estate agent, real estate broker, retail, retail real estate, retail space, Tenant Representation, tenant representative, ubreakifix, york

Census Data: National and Local Trends You Need to Watch

Posted on June 3, 2019 by Mike Kushner in Blog, Commercial Real Estate, CPBJ Articles, Local Market, Trends No Comments

Note: This article was published by the Central Penn Business Journal. Click here to read the original version.


Census data provides a fascinating look into population growth trends that stand to have a profound impact on our economy, both locally and nationally. More than just being “interesting” data to study, population growth and decline points us to important trends that will reshape supply and demand in various industries, one of the most prominent being real estate.

Just last month, the US Census Bureau released new population estimates. These estimates account for and compare the resident population for counties between the dates of April 1, 2010 to July 1, 2018. The outcome? There are shifts in population taking place across the nation that may differ from what you might assume. Let’s take a look at some of the highlights from this data from a national and local level.

At a National Level

South and West Lead Population Growth

The census data confirmed that counties with the largest numeric growth are located in the south and the west regions. In fact, Texas claimed four out of the top 10 spots. Looking at population growth by metropolitan area, Dallas-Fort Worth-Arlington, Texas, had the largest numeric growth with a gain of 131,767 people, or 1.8 percent taking place in 2018. Second was Phoenix-Mesa-Scottsdale, Arizona which had an increase of 96,268 people, or 2.0 percent. The cause of growth in these areas is the result of migration, both domestic and international, as well as natural increase. In Dallas, it was natural increase which served as the largest source of population growth, whereas in Phoenix I was migration.

Fastest Growth Occurred Outside of Metropolitan Areas

Surprisingly, no new metro areas moved into the top 10 largest areas. Of the 390 metro areas within the US (including the District of Columbia and Puerto Rico), 102 of these areas, or 26.2 percent experienced population decline in 2018. The five fastest-decreasing metro areas (excluding PR) were Charleston, West Virginia (-1.6 percent); Pine Bluff, Arkansas. (-1.5 percent); Farmington, New Mexico (-1.5 percent); Danville, Illinois (-1.2 percent); and Watertown-Fort Drum, New York (-1.2 percent). The population decreases were primarily due to negative net domestic migration.

North Dakota Claims Fastest Growing County

Among counties with a population of 20,000 or more, Williams County, North Dakota claimed the top spot as the fastest-growing county by percentage. This county increased by 5.9 percent between 2017 and 2018 (from 33,395 to 35,350 people). The rapid growth Williams County experienced was due mainly to net domestic migration, 1,471 people, in 2018. The county also experienced growth between 2017 and 2018 by both natural increase of 427 people, and international migration of 52 people.

More Growth than Decline

Out of 3,142 counties, 1,739 (or 55.3 percent) gained population between 2017 and 2018. Twelve counties (0.4 percent) experienced no change in population, and the remaining 1,391 (or 44.3 percent) lost population. Between 2010 and 2018, a total of 1,481 (or 47.1 percent) counties gained population and 1,661 (or 52.9 percent) lost population. Though there has been more growth than decline overall, the numbers indicate that this can easily shift year over year.

At a Local Level

Dauphin County

 Lancaster County

York County

Cumberland County

Cumberland, Dauphin, Lancaster and York Experience Consistent Growth

The most notable trend to take place between 2010 and 2018 in Central PA is that these counties all experienced consistent growth year-over-year. Moreover the growth occurred fairly evenly over the last 8 years. This provides consistency and enables the economy to respond to the growth over a reasonable amount of time.

Counties Also Maintain Same Order of Ranking in Population

Another trend worth noting is that the counties have maintained the same order of ranking based upon population for 8+ years. For example, in 2010 these counties in order of smallest population to largest population was Cumberland, Dauphin, York, Lancaster. This is the same ranking we see in 2018, and every year in between. No county surpassed another at any point.

Lancaster Remains Largest and Fastest Growing County

Lancaster County has a major lead in population over the others. At 984 square miles, it is also the largest of the 4 counties. Between 2010 and 2018 it also experienced the largest numeric growth at 24,112 people. Number two in numeric growth was actually the smallest of the four counties, Cumberland County, which grew by 16,017 people. York County grew by 13,301 people and Dauphin County grew by 8,997 people.

Overall, the latest US Census offers valuable and insightful information related to population growth between 2010 and 2018. Understanding the cause of either growth or decline provides framework for how these shifts may continue on their course, or change in the future.

A deeper dive into the census data reveals several demographic changes impacting commercial real estate development: household formations, aging baby boomers, growing millennials, women in the workforce, and migration toward the South.

Today’s demographic changes present challenges for commercial real estate developers, but they also offer lucrative opportunities to firms creatively adapting to new demands.

[Online Resources] Real Estate, 2018, america, analysis, blog, blogger, camp hill, carlisle, census, census bureau, central pa, central penn business journal, change, Commercial Real Estate, cumberland, data, dauphin, decline, facts, growth, harrisburg, hershey, homes, hummelstown, increase, information, lancaster, lemoyne, local, local market, migration, Mike Kushner, nation, national, pennsylvania, population, real estate agent, real estate broker, residential, statistics, trends, united states, york

Power Landlords: Who Owns the Most Office Space in Central PA?

Posted on May 30, 2019 by Mike Kushner in Blog, Commercial Real Estate, Local Market No Comments

These are buildings that you have likely passed countless times. Whether you live in Central Pennsylvania, or any other part of the world, real estate is all around us. Have you ever stopped to wonder who owns a particular piece of real estate? Maybe it’s the not the first question you’re asking on your morning commute, or when out running an errand, but the answer to this question may fascinate you.

Particularly the commercial real estate industry holds a lot of potential to impact economic development in a region. For entities who have made it a business to accrue large amounts of commercial real estate, they provide us with valuable insight into to the state of the economy, based upon their decision to buy or sell/lease space and at what price point. Knowing who the big players are can help keep us apprised of changes in the market that will ultimately trickle down to impact businesses far and wide.

So who are these businesses and how much property do they own? Among private, for-profit entities located in Central Pennsylvania, these are the top five “power landlords” who own the most office space in the region.

  1. Linlo Properties

According to a CoStar Group analysis on April 5, Linlo Properties owns 745,349 square feet of space in Central Pennsylvania. Linlo’s assets include the AT&T Building, an 87,718 square-foot building at 2550 Interstate Drive; 4250 Crums Mill Road, a 75,000 square-foot building; Vista Plaza, a 71,800 square-foot building at 1215 Manor Drive; and Hillside Corporate Center, a 68,525 square-foot building located at 5001 Louise Drive.

  1. Healthcare Trust, Inc.

Healthcare Trust, Inc., a non-traded traded real estate investment trust that focuses primarily on healthcare related assets, comes in second, per CoStar data, with all its 638,516 square feet purchased from UPMC Pinnacle (formerly Pinnacle Health) in 2014. The Landis Building, located at 2501 North Third Street (formerly part of Polyclinic Hospital) is its largest holding at 314,790 square feet.

  1. High Associates

High Associates is the third-biggest property owner in the region with 561,276 square feet of commercial real estate. All their properties are in Lancaster County except 5000 Ritter Road, Mechanicsburg. 1853 William Penn Way, their largest holding, which is 82,331 square feet of space, is occupied by the High Companies.

  1. Select Capital Commercial Properties

Fourth is Select Capital Commercial Properties with 544,599 square feet of commercial real estate. Select Capital’s holdings include 225 Grandview Avenue (the former HP/EDS building) with 214,150 square feet; 300 North Second Street (Commerce Towers) with 72,000 square feet; and 425 N. 21st Street (Plaza 21) with 62,304 square feet.

  1. Hoffer Properties

Hoffer Properties ranks fifth with 531,741 square feet of space. Hoffer’s assets include 100 Sterling Parkway (the former PHICO building), a 220,000 square-foot building and 300 Sterling Parkway, the 129,000 square foot building built in 2016 for Deloitte.

These power landlords of Central PA hold a significant amount of commercial real estate assets. How they choose to use and further develop this space has the potential to shape the economy, locally and beyond, by attracting new businesses which brings new jobs. With the backing of these large entities who are continually investing in and improving commercial real estate, every business in the region benefits from the ripple of this economic impact.

It’s important to note that this list is limited to private, for-profit entities located in Central PA. Hbg. Realty Inc. (Harristown Development Corp.), PA Economic Development Agency, The Commonwealth of Pennsylvania, and Highmark, Inc. all rank higher than the top five on this list.

[Online Resources] Real Estate, camp hill, carlisle, central pa, central pennsylvania, Commercial Real Estate, costar, harrisburg, healthcare trust, high associates, hoffer properties, lancaster, landlord, Leasing, linlo properties, local, mechanicsburg, Mike Kushner, office, office real estate, Office Space, Omni Realty Group, pennsylvania, real estate agent, real estate broker, select capital commercial properties, selling, tenant representative, trends, york

Growing Demand for “Live-Work-Play” Communities in Central PA

Posted on December 4, 2018 by Mike Kushner in Blog, Commercial Real Estate, Community, Guest Blogger, Local Market, Trends No Comments

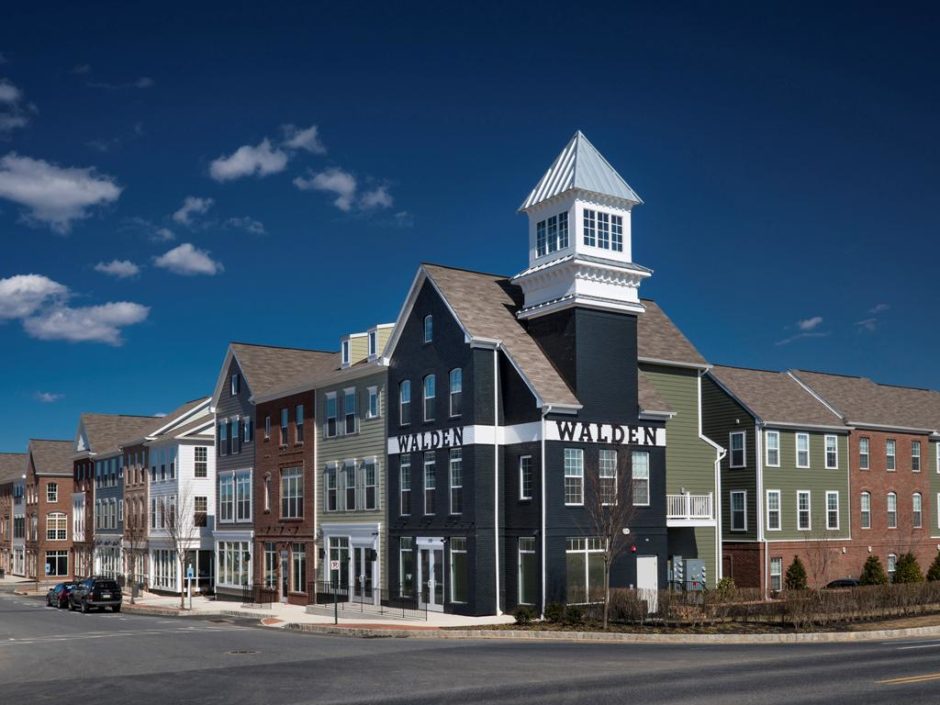
Photo: Walden in Mechanicsburg, PA

If you’ve been a resident of Central Pennsylvania for more than a few years, you’ve likely seen various live-work-play (LWP) communities – maybe you even live in one. What we’re talking about it mixed-use commercial and residential real estate where people have the opportunity to live, work and play (shop, dine, etc.) all in a relatively close distance to one another. A great example is the Walden community in Mechanicsburg, but there are many others that we will examine in this article.

To help us explore this growing trend, we turned to Chris LeBarton who is a Senior Market Analyst with CoStar Group. Chris covers commercial real estate data in Western Maryland, including the Baltimore metro area, up through Central Pennsylvania for CoStar’s Market Analytics platform.

Chris joins Mike Kushner of Omni Realty Group for a Q&A series where we specifically look at the growing demand for LWP communities in Central PA – and what this means for CRE professionals. Here is how Chris answers our most pressing questions.

Omni: When did the LWP trend begin and how has it grown?

Chris LeBarton: The earliest usage of LWP spaces I can find was in 2005. The trend really started to grow in popularity leading up to the market crash, but there’s no correlation between the two that I can see. The term “live-work-play” was very likely used prior to that, but I’m guessing the branding of mixed-use development really took off as concepts of ‘walkable urbanism’ and ‘Transit Oriented Development’ (TOD) exploded across the country.

According to the Urban Land Institute’s Mixed-Use Development Handbook, which was published in 2003, mixed-use development: provides three or more significant revenue-producing uses (such as retail/entertainment, office, residential, hotel, and/or civic/cultural/recreation); fosters integration, density, and compatibility of land uses, and; creates a walkable community with uninterrupted pedestrian connections.

Omni: Describe a LWP community in Central PA.

Chris LeBarton: First, let’s clarify what a LWP community really is, and what it is not. Some economic development entities and marketing types play pretty fast and loose with the term. An area can be a really nice place to live, work and play in, but if there’s over a mile or so between one element of the triad and the other two legs of the stool aren’t in the same building/development, it’s not really a LWP dynamic. Of course, the likelihood that most people who live in one of these communities also works in the same office/industrial park nearby is fairly low. But being able to do all three and be largely reliant on public transportation or your own two feet is really the spirit of the LWP concept.

Another key element to understand is that LWP is not at all relegated to a city environment. In fact, part of these projects’ collective appeal is that they can recreate a city environment without being in the hustle and bustle of a CBD. Specifically in Central Pennsylvania, there are a number of LWP developments. Here are just a few:

  • Lime Spring Square (Lancaster/Hempfield Township): A multi-phase, mixed-use campus being developed by Oaktree Development Group, the end result will include over 100,000 SF of retail, several hundred high-end apartments, and components of office, medical and industrial space. Penn State Health has a 76,000 SF medical office building there, while PDQ Industries is expanding operations into an 80,000 SF building.
  • North Cornwall Commons (Lebanon/North Cornwall Township): Another phased project that has been delayed off and on since being proposed in 2004, North Cornwall Commons is finally seeing movement at what would be the largest mixed-use development in Lebanon County history. A retail strip center with at least one confirmed tenant (a local coffee business) is underway at 148-acre site that includes plans for roughly 165 townhomes, office space and a hotel.
  • The 1500 Condominium (Harrisburg): An example of how you don’t have to have everything in one place, 1500 has 43 units (mostly rentals) that sit over top of two restaurants and is within walking distance to the Broad Street Market and several small-to-medium sized employers.
  • Wyomissing Square (Reading/Wyomissing Borough): A quintessential brownfield redevelopment, Wyomissing Square now consists of 250 4 Star apartments, a Courtyard by Marriott, small-scale retail, restaurants, and a 60,000 SF medical office building.

Omni: Who is the target demographic for this type of community?

Chris LeBarton: As with anything that deals with where people live, shop/eat or work, I think the answer is “All of the Above.” We hear all too often about Millennials, or Boomers, or Downsizers, or Divorcees. Honestly, the more conversations I have with leasing agents and brokers the more I’m convinced the rule is diversity and the exception is homogeneity. Granted, most of these LWP sites cater to the more upscale or educated among society, but that doesn’t mean there can’t be families with two working blue collar parents who make a decent living and who want to save money on a car/parking and live close to work.

Omni: What advice could help commercial real estate professionals capitalize on the LWP trend?

Chris LeBarton: I don’t give investment advice, but here are a couple thoughts. First, find a way to make it authentic. Be it the retail mix, or a unique concept to the green space, or simply having the “town center” not look boiler plate, be conscientious of that buzz word “place making.” If you’re going to basically spend the majority of your waking life in a small area, it can’t be boring or cookie cutter.

Next, think ahead. What will you need to provide 3-5 years from now? Who would have thought that cities would be crawling with scooters?! Or even just electric vehicles. People looking to walk or be publicly transported or drive as little/cheaply as possible will likely demand options and flexibility. Things to consider are multiple charging stations, bike share platforms, car-share parking lots, etc.

Finally, identify fairly gentrified but not-yet-there locations that are retail/grocery deserts. LWP in the middle of a depressed community won’t work in many places (there are exceptions, of course). But cool/changing areas that are the next ‘it place’ often still need the food and fun to complete the shift.

Omni: Looking to the future, how do you predict LWP communities to evolve in Central PA?

Chris LeBarton: I think you can expect to see more of these types of projects turn up around dying malls or outlet centers that have to repurpose big blocks of space. Another interesting new trend that I could see taking off is the rise of co-living and co-working spaces in the same building.

The LWP trend stands to have a significant impact on Central PA’s commercial real estate market. Because LWP communities rejuvenate the local community, drive business and create employment opportunities, Central PA should be encouraged that so many of these communities are popping up across the region. Additionally this type of real estate appeals to a wide variety of demographics, making it a valuable investment opportunity for commercial real estate professionals. Looking to the future, LWP communities could be among the most powerful tools to breathe new life into struggling areas, and spur a burst of new economic activity that is greatly needed.

What are your thoughts on the growing demand for live-work-place communities in Central Pennsylvania? Is this type of community attractive to you? Why or why not?

[Online Resources] Real Estate, analyst, buyers agent, camp hill, carlisle, central pennsylvania, chris lebarton, Commercial Real Estate, costar, CRE, harrisburg, hershey, lancaster, live work play, local, LWP, mechanicsburg, Mike Kushner, mixed use, office, Omni Realty Group, pennsylvania, real estate agent, real estate broker, real estate investor, residential, retail, tenant representative, trends, york

Central PA Office Submarkets End Quarter with Very Different Outcomes

Posted on November 8, 2018 by Mike Kushner in Blog, Local Market, Trends No Comments

Lancaster closes Q3 with the strongest market while Harrisburg West shows signs of distress.

The submarkets that make up Central Pennsylvania’s office real estate market each have unique advantages and disadvantages that really show through when you examine each individually. With the close of the third-quarter, we took a closer look at how the four main submarkets performed individually and comparatively.

The outcomes should surprise you! You may think you know which of the four submarkets outperformed the others, which one is most likely in distress and the others that are sitting pretty stagnant right now. But you’ll likely be shocked by the large variances in numbers, especially when compared to the historical averages and forecasted averages of what is yet to come.

Let’s take a closer look at some of the most interesting trends and numbers reported from CoStar’s Q3 2018 office report for Harrisburg East, Harrisburg West, Lancaster and York.

Harrisburg East

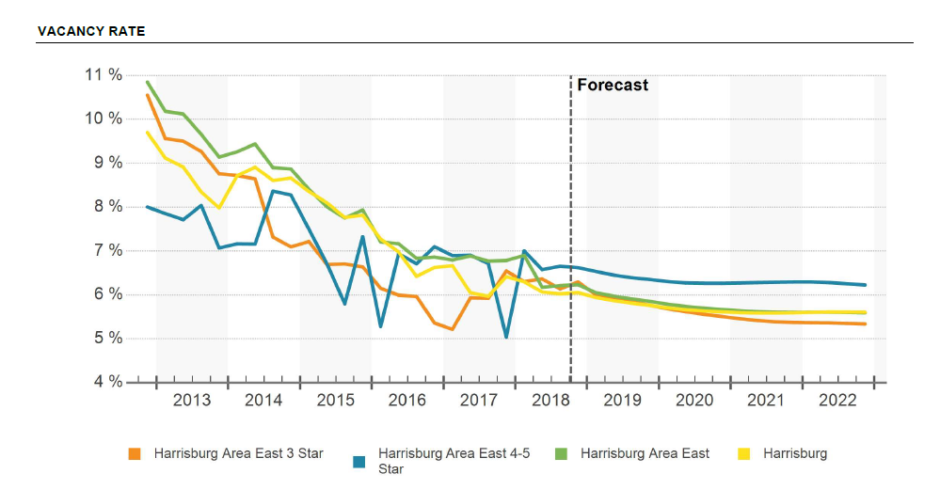
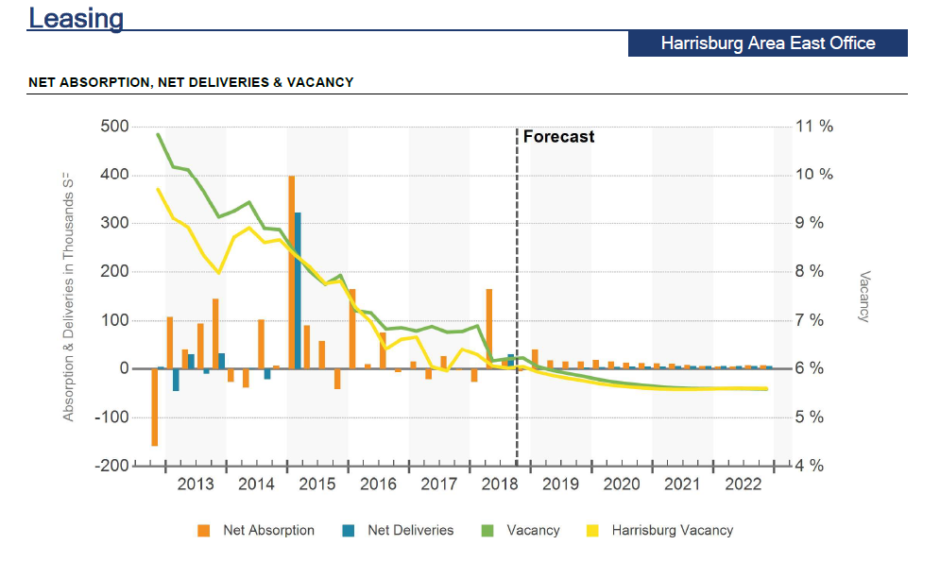
Vacancy – The vacancy rate for Q3 2018 in the Harrisburg East submarket is 6.4%. This is notably lower than the historical average of 7.8% and the forecast average shows this dipping lower to 5.7%. For comparison, the peak in vacancy rate occurred in Q4 2012 when it reached 10.8% and the trough was in Q4 1997 when it plummeted to 3.1%.

12 Month Net Absorption in SF – The twelve-month net absorption is 106,000 square-feet. While this is still lower than the historical average of 187,046 square-feet, the forecast average predicts the current net absorption will fall significantly to 61,648 square-feet. Though not by much, net absorption will at least remain in the black for now.

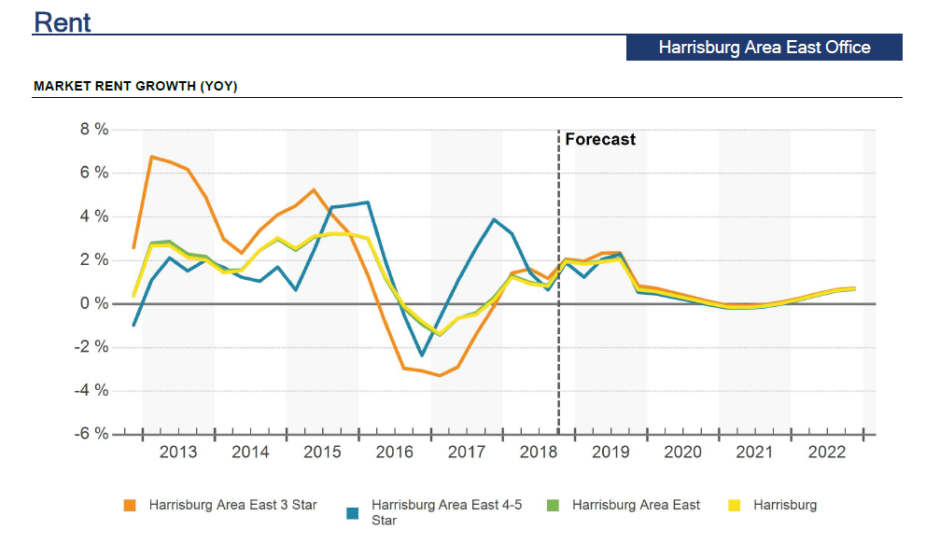
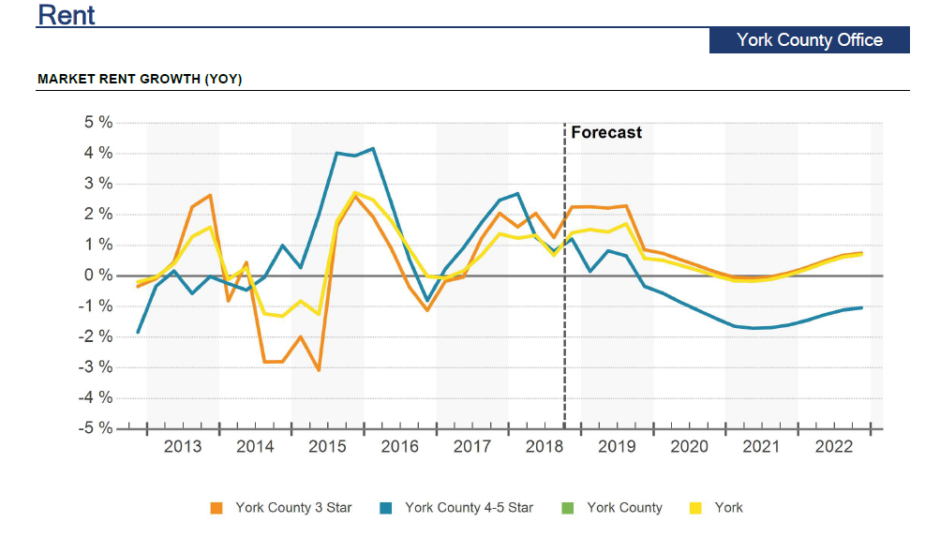
Rent Growth – The current 12 month rent growth is 2.0%. This is higher than the historical average of 1.4%, though the forecast average predicts that this will fall to 0.7%. For comparison, the peak in Harrisburg East’s rent growth occurred in Q1 2001 when it reached 8.3% and the trough was in Q4 2009 when it plummeted to -2.4%.

12 month deliveries in SF – Harrisburg East has a twelve-month delivery of 30,000 square-feet. This takes into account all of the deliveries that occurred over the last year; however no new buildings were delivered specifically in Q3 2018. Additionally, 20,000 square-feet of 4 and 5 star office space is under construction, which will be delivered in coming quarters.

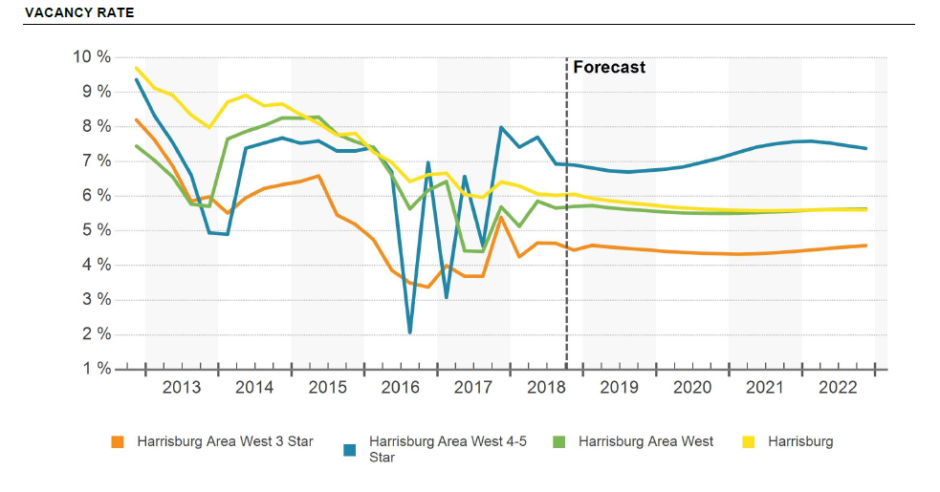
Harrisburg West

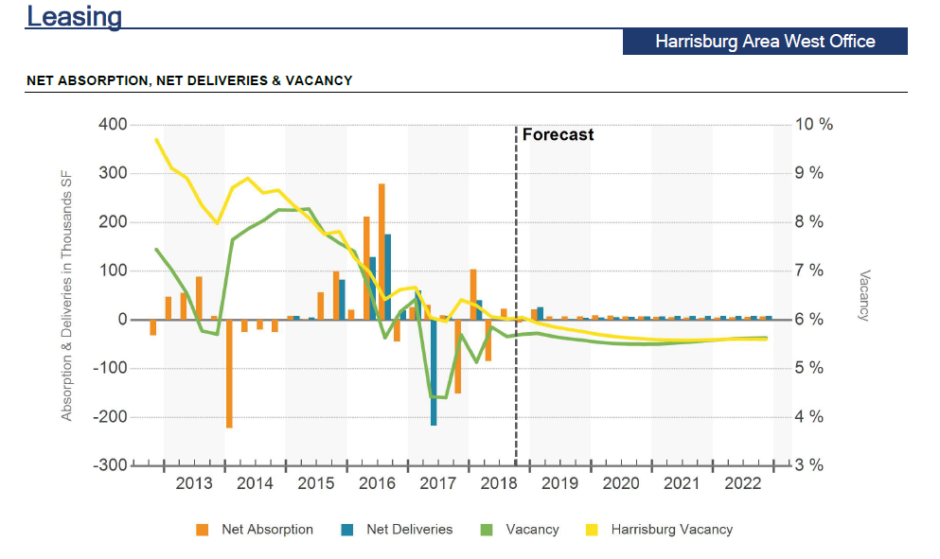
Vacancy – The vacancy rate for Q3 2018 in the Harrisburg West submarket is 7.3%. This is slightly higher than the historical average of 7.0%; however, CoStar’s forecast average predicts this to dip to 5.6%. For comparison, the peak in vacancy rate occurred in Q2 2002 when it reached 9.8% and the trough was in Q4 1997 when it plummeted to 2.5%.

12 Month Net Absorption in SF – The twelve-month net absorption is negative 258,000 square-feet. The historical average is 95,454 square-feet and the forecast average predicts the market will again return to positive numbers with 25,193 square-feet. Q3 net absorption is not far from where it was in Q4 2014 when it was negative w 292,042 square-feet. Since then, it peaked in Q3 2016 at 611,057 square-feet before falling substantially to its current negative state.

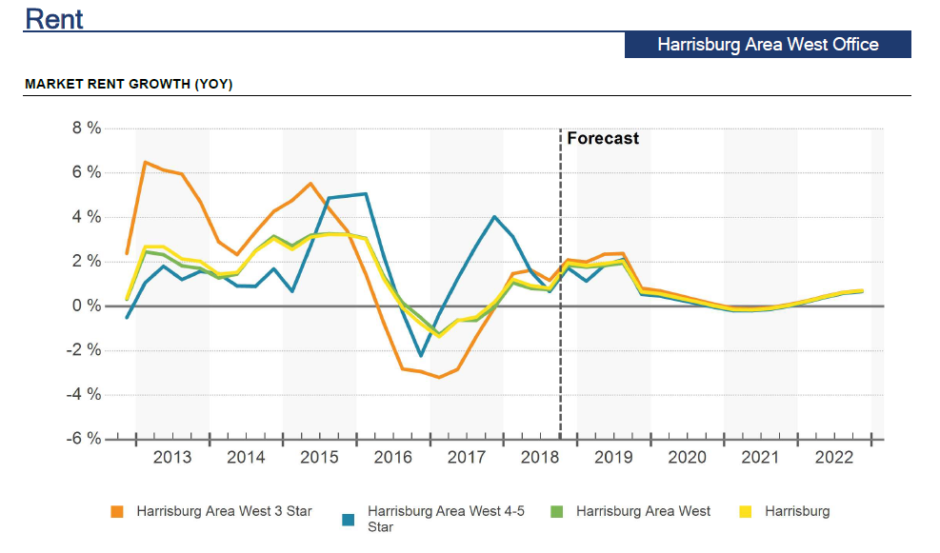
Rent Growth – The current 12 month rent growth is 1.9%. This is higher than the historical average of 1.4%, though the forecast average predicts that this will fall to 0.6%. For comparison, the peak in Harrisburg West’s rent growth occurred in Q3 2000 when it reached 7.1% and the trough was in Q4 2009 when it plummeted to -2.8%.

12 month deliveries in SF – Harrisburg West has a twelve-month delivery of 40,000 square-feet, compared to the historical average of 127,660 square-feet. This takes into account all of the deliveries that occurred over the last year; however no new buildings were delivered specifically in Q3 2018. Additionally, 26,400 square-feet of 3 star office space is under construction, which will be delivered in coming quarters.

Lancaster

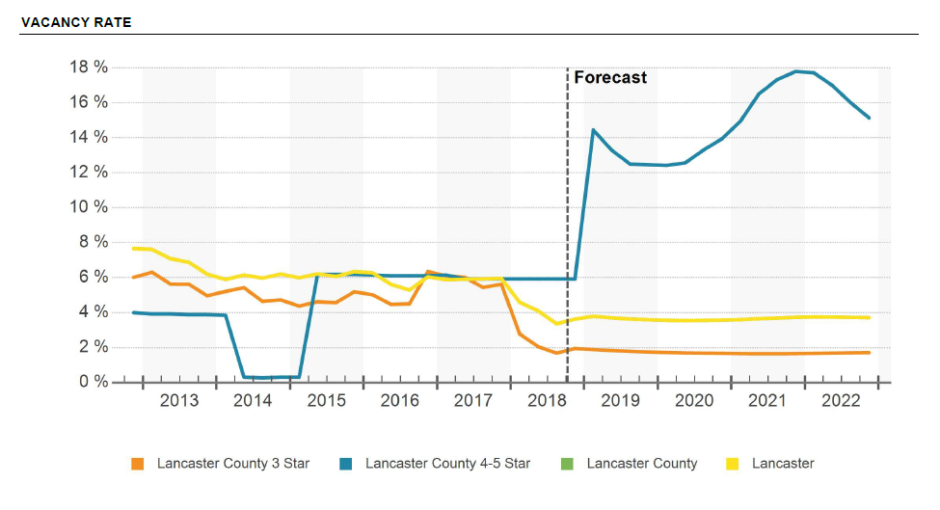
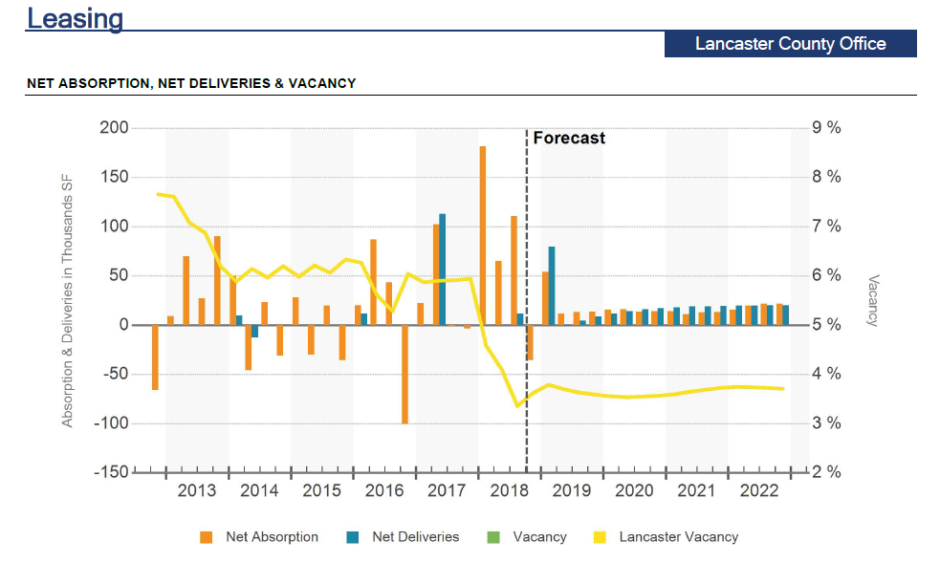
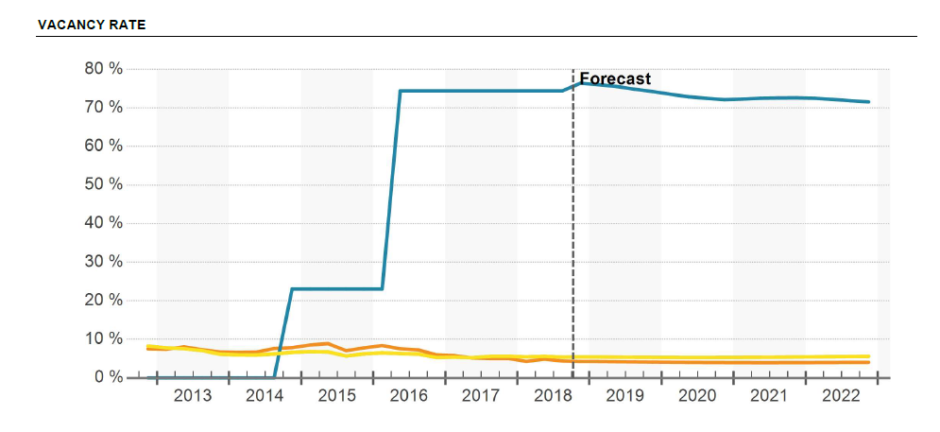
Vacancy – The vacancy rate for Q3 2018 in the Lancaster submarket is 3.6%. This is notably lower than the historical average of 6.8%; the forecast average predicts this remain fairly stable at 3.7%. For comparison, the peak in vacancy rate occurred in Q4 2004 when it reached 9.7%. The lowest the vacancy rate has ever been in Lancaster County is actually right now, in Q3 2018.

12 Month Net Absorption in SF – The twelve-month net absorption is 324,000 square-feet. The historical average is substantially lower than what it is currently and that is 109,103 square-feet. The forecast average predicts net absorption will decrease to 89,086 square-feet.

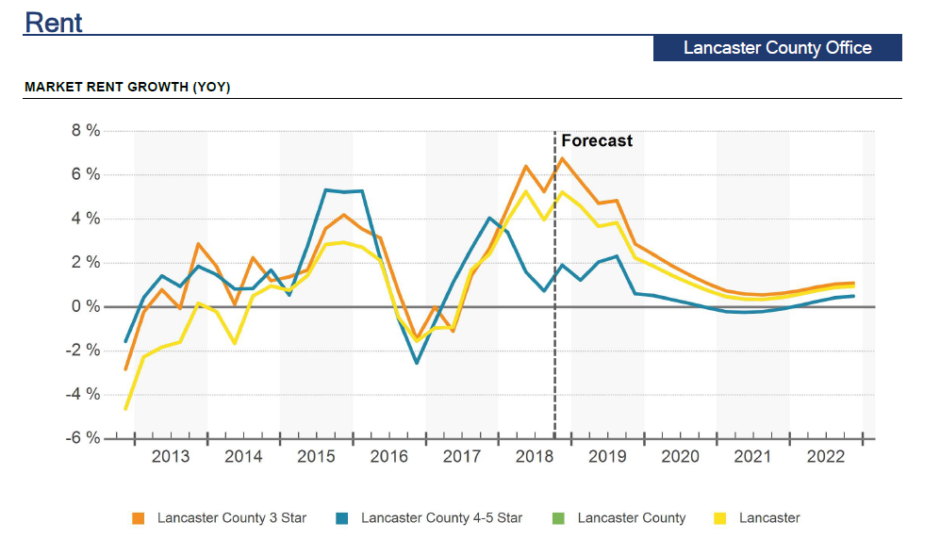
Rent Growth – The current 12 month rent growth is 4.9%. This is significantly higher than the historical average of 1.3%, though the forecast average predicts that this will fall to 1.6%. For comparison, the peak in Lancaster’s rent growth occurred in Q3 2000 when it reached 6.9% and the trough was in Q4 2009 when it plummeted to -5.0%.

12 month deliveries in SF – Lancaster has a twelve-month delivery of 12,000 square-feet, compared to the historical average of 114,237 square-feet. This takes into account all of the deliveries that occurred over the last year; however no new buildings were delivered specifically in Q3 2018. Additionally, 81,840 square-feet of 4 and 5 star office space is under construction, which will be delivered in coming quarters.

York

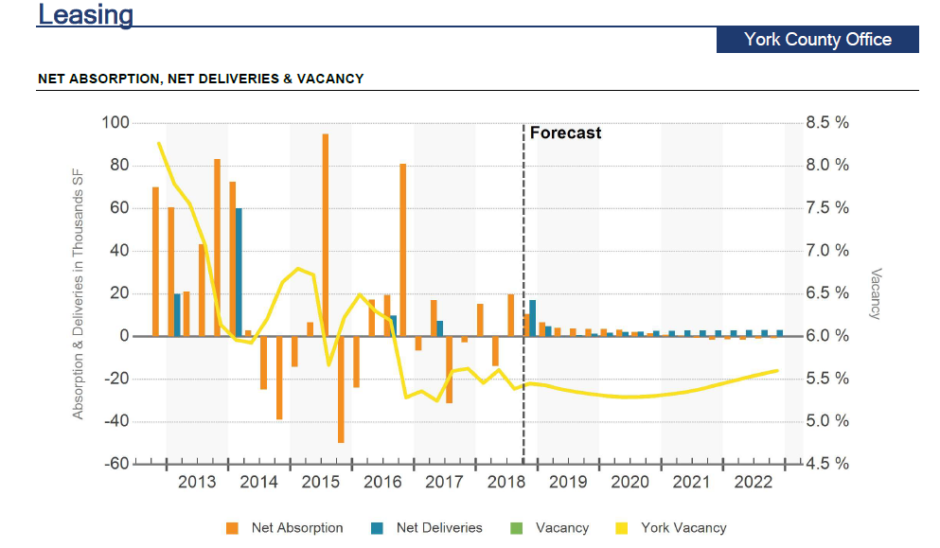
Vacancy – The vacancy rate for Q3 2018 in the York submarket is 5.3%. This is lower than the historical average of 6.9%; the forecast average predicts this remain fairly stable at 5.4%. For comparison, the peak in vacancy rate occurred in Q1 2008 when it reached 10.5%. The lowest the vacancy rate has ever been was 2.2% in Q4 1998.

12 Month Net Absorption in SF – The twelve-month net absorption is 29,500 square-feet. The historical average is 72,892 square-feet. The forecast average predicts net absorption will decrease to 8,847 square-feet.

Rent Growth – The current 12 month rent growth is 1.6%. This is fairly close in line with the historical average of 1.1%, though the forecast average predicts that this will fall to 0.6%. For comparison, the peak in York’s rent growth occurred in Q3 2000 when it reached 6.8% and the trough was in Q3 2009 when it plummeted to -4.3%.

12 month deliveries in SF – York has a twelve-month delivery of 0 square-feet, compared to the historical average of 80,056 square-feet. The forecast average predicts that this rise to 13,093 square-feet. Additionally, 22,000 square-feet of office space is under construction, 17,000 square-feet of 4 and 5 star space and 5,000 square-feet of 3 star space, which will be delivered in coming quarters.

Key Takeaways

Overall, York County and Harrisburg East have been very stable. Not much is moving the needle. There is not a lot of absorption nor much new construction that could spur activity.

The real positive news from Q3 2018 is Lancaster County. This submarket rose above the rest for several reasons. First is its 324,000 square-feet in net absorption and 4.9% rent growth (highest since Q3 2003). Additionally the vacancy rate decreased 2.3%. Currently there are 81,840 square-feet under construction and 89,166 square-feet of new construction proposed.

In contrast, the Harrisburg West submarket is showing signs of distress. Its negative 282,000 square-feet of net absorption combined with a modest vacancy rate increase of 1.6% does not offer much hope for a major turnaround anytime soon. Additionally, the submarket has 86,400 square-feet of new office space under construction and 225,596 square-feet of proposed new space that the market will struggle to absorb, further driving down the net absorption.

Based on the activity taking place in Central Pennsylvania’s office real estate submarkets, how do you think this will impact business growth and development throughout these counties? How will this have a ripple effect into other areas of our economy?

Share your ideas by leaving a comment below!

[Online Resources] Real Estate, analysis, central pa, Class A, Class B, Class C, Commercial Real Estate, commercial real estate agent, commercial real estate broker, costar, east, harrisburg, lancaster, local, market, Mike Kushner, office, office real estate, Office Space, Omni Realty Group, pennsylvania, real estate agent, real estate broker, realty, report, stats, tenant representative, trends, west, york

Central Pennsylvania Office Real Estate Report for Q2 2017

Posted on August 14, 2017 by Mike Kushner in Blog, Commercial Real Estate, Local Market, Trends No Comments

Decrease in vacancy and recent record high for rental rates indicate a healthy demand for Central Pennsylvania Office Space.

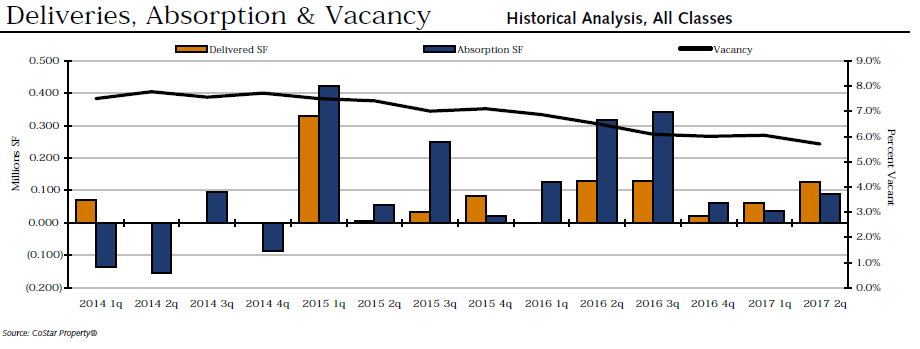
Central Pennsylvania’s office real estate market should have very few concerns or complaints based upon its performance in Q2 2017. Three new office spaces were delivered this quarter, all of which are 100% preleased. As a result, net absorption continued to rise into the black by more than 50,000 square feet. Vacancy declined as did vacant square footage. Most noteworthy, the quoted rental rate jumped by $0.10 per square foot, making this quarter the highest quoted rental rate the market has seen since prior to Q3 2013!

In addition to these highlights, there is a lot more we can take away from the local office real estate market’s performance this last quarter. Here are the major actions that have taken place in Central Pennsylvania according to CoStar’s Q2 Office Statistics.

SELECT YEAR-TO-DATE DELIVERIES

Three new office spaces entered the market in Q2 2017 and they all made it to CoStar’s Select Top Year-to-Date Deliveries. The largest of the three is at 100 Millport Road in Lancaster. The 93,000 square-feet of B Class office space is 100% prelease. Next on the list for Central PA’s Q2 deliveries is the Goodville Mutual Expansion located in Lancaster. Goodville Mutual Casualty Company added on an additional 20,000 square-feet of Class B office space that is 100% prelease.  Last but not least is the 13,000 square-foot Class B office space located at 40 Old Willow Mill Road in Mechanicsburg that is 100% preleased to Penn State Medical Group.

SELECT TOP LEASES

Of the Select Top Leases featured in the Q2 CoStar Office Market Report, just one lease from the Central Pennsylvania submarket made the list, but it did so at number 5. A large healthcare company, Centene leased the office space at 300 Corporate Center Drive, Harrisburg from Cushman & Wakefeld. The total space of the lease is 68,846 square-feet.

ABSORPTION

Net absorption is back on the rise, after taking a hit last quarter. In Q2 it was just 35,817 square-feet; now it is 88,814 square-feet. Though there is a long way to go to reach the recent record high of 421,430 square-feet that we saw in the beginning of 2015, we are at least headed back in the right direction. Considering three new buildings entered the market this month with a combined 126,000 square-feet of space, it’s a good indicator of market demand that net absorption rose.

OVERALL VACANCY & RENTAL RATES (ALL CLASSES)

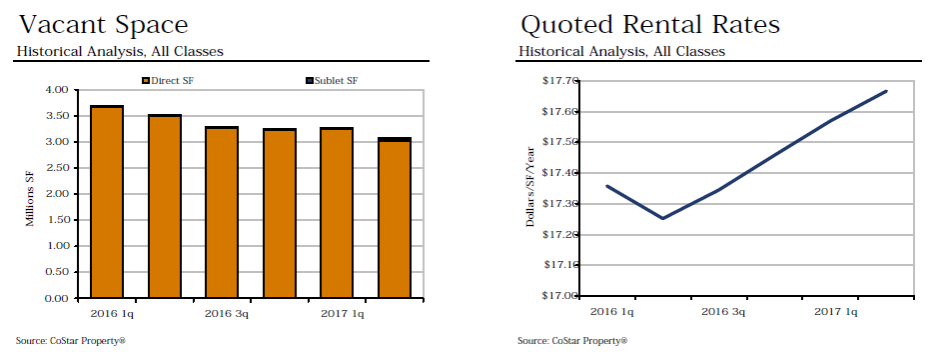
This quarter, the market experienced a decrease in vacancy from 6.0% last quarter to 5.7% currently. This correlates with the decrease in vacant square-footage, down from last quarter’s 3,273,675 square-feet to 3,080,214 square-feet currently. Most noteworthy, the quoted rental rate has risen significantly, $0.10 per square foot in just one quarter. It now stands at $17.67 per square foot which is higher than it’s been since prior to Q3 2013. With only one building under construction, new space will not be entering the market anytime soon, forcing businesses to continue to use up existing inventory.

CLASS A TRENDS

Specifically looking at class A office space, vacancy is at 8.2% and the quoted rental rate is $20.80 per square-foot. The year-to-date net absorption is 20,217 square-feet, with 60,000 square-feet in year-to-date deliveries and 40,000 square-feet currently under construction.

CLASS B TRENDS

Specifically looking at class B office space, vacancy is at 5.5% and the quoted rental rate is $17.36 per square-foot. The year-to-date net absorption is 235,677 square-feet, with 126,000 square-feet in year-to-date deliveries. No new buildings are currently under construction.

CLASS C TRENDS

Specifically looking at class C office space, vacancy is at 4.7% and the quoted rental rate is $15.79 per square-foot. The year-to-date net absorption is negative 131,263 square-feet. This is a major drop compared to the other classes and the overall net absorption for the Central PA submarket as a whole. There are zero year-to-date deliveries and zero projects under construction for class C space.

What trend from the second quarter did you find most interesting or impactful to Central Pennsylvania’s office market? Share your opinion by leaving a comment!

Learn more from past market reports:

Central Pennsylvania Industrial Real Estate Report for Q2 2017

Central Pennsylvania Industrial Real Estate Report for Q1 2017

Central PA’s Office Real Estate Market Hangs on to Low Vacancy, Slows Down on Net Absorption

[Online Resources] Real Estate, 2017, buyers agent, carlisle, central pennsylvania, Commercial Real Estate, costar, harrisburg, hershey, lancaster, lease, lemoyne, market, mechanicsburg, Mike Kushner, new cumberland, office, Omni Realty Group, q2, real estate agent, real estate broker, rent, report, second quarter, space, statistics, tenant representative, trends, york

Subscribe To Our Blog

  • This field is for validation purposes and should be left unchanged.

Mike J Kushner, CCIM

  • Contact me for a FREE Lease Review!
  • This field is for validation purposes and should be left unchanged.

Categories

  • About Us
  • Blog
  • CCIM
  • Commercial Real Estate
  • Community
  • Construction
  • CPBJ Articles
  • CREDC Articles
  • Feature
  • Featured Opportunities
  • Guest Blogger
  • Healthcare
  • In the News
  • Industrial
  • Local Market
  • Office Leasing
  • Retail
  • Success Stories
  • Tenant Representative/Buyer Agent
  • Trends

(c) 2019 OMNI REALTY GROUP- Website Design by The John Webster Company