OMNI Realty Group
  • Email
  • Facebook
  • Linkedin
  • Twitter
  • Rss
  • Home
  • Omni Advantage
    • Success Stories
    • Our Clients
    • Completed Deals
    • In the News
  • Services
  • Resources
    • Market Reports
    • Local Market
    • Office Space Calculator
    • CCIM Advantage
      • User Investment
      • CCIM Brochure
      • Total Expertise
      • Distinguish Yourself
      • How Would You Rate
  • Global Reach
  • Property Search
  • FAQ
  • Blog
  • Contact Us

Posts tagged "data"

Home» Posts tagged "data"

Is a new kind of “crash” on the horizon for real estate?

Posted on August 30, 2021 by Mike Kushner in Blog, Commercial Real Estate, Local Market, Trends No Comments

It doesn’t take more than a quick glance through the news to read something about the fast and wild real estate market that has risen from the chaos of a global pandemic. Listings are selling within days of hitting the market, well above asking price, and construction can hardly keep up with the demand for new residential and commercial properties. There are many factors impacting the temperature of the market which make it quite different than the real estate “boom” we know all too well from 2008 – as well as the crash that followed.

Should real estate professionals as well as buyers, sellers, and builders be wary of a similar crash on the horizon? Without a doubt, the market cannot sustain this pace indefinitely, but it also doesn’t mean it will end in a crash-and-burn (or rather explosive) style that it did in 2008. Keep reading for a high-level overview of why the 2021 real estate boom is unique, and what we can expect as the tides inevitably turn.

Noteworthy Differences Between 2021 and 2008

Lower leverage and higher down payments – When the market corrected itself in 2008, overleveraged home buyers brought down the housing market, and some of that contagion spread throughout the rest of the property markets quickly causing a “wildfire” of sorts. As we now approach Q4 of 2021, the housing market is robust with buyers coming in with lower leverage than ever. Despite record-high housing prices, we’re also seeing a record-high percentage of house buyers bringing in 20% down payment or better. Meanwhile, 26% of all houses are sold to cash buyers. With so much money being printed by the Federal Reserve and still tight underwriting standards, only the most well-qualified house buyers are getting a chance to buy and even they are swamping the available inventory.

Slow and low construction – Housing construction levels remain well below that of the 2005–2007 period, which preceded the 2008–2010 correction. Part of that is due to wary housing builders who lived through the chaos of 2008. Another consideration is the disrupted supply chains due to COVID-19 deaths, illnesses, and lockdowns. Until we can fully resolve the prolonged impact of COVID-19 on a global basis, we can expect to deal with supply chain issues and higher prices from inadequate supply. And unfortunately, with the way that variants are arising from all the global hot spots, combined with anti-vaxxers, it’s going to be a long haul out of this storm.

Falling interest rates – Right now interest rates remain at record lows and falling. Interest rates will continue to fall during the current inflation spike and after; that’s how the mechanism of Federal Reserve money printing works. But it’s not advised to expect interest rates to climb just because rates are low today. Until the Federal Reserve changes its policy direction, there is no catalyst for higher interest rates, at least not yet.

Preparing for Impact: What kind of crash to expect?

Collectively, real estate professionals agree that a crash is on the horizon for office and retail real estate. Although “crash” may be too strong of a word – rather we should view it as a natural flow to the ebb we’ve experienced, and a course correction like what must occur after any major market shift.

Here are some important things that are boiling under the surface that will have an impact on the market sooner than later. Even with the general reopening of the U.S. economy, nationally office space demand is nowhere near what the still high asking prices for office buildings would imply. Furthermore, retail is getting crushed by online shopping, which reached escape velocity during the COVID-19 lockdowns. So, those two property segments have a lot of room to fall until property owners figure out how to adapt. The hard reality is that many commercial property owners may simply run out of cash before they can adapt and some of that price drop may spread to neighboring housing in 2022–2023.

Our current market is driven by supply and demand.  While no one can predict the future with 100% accuracy, I don’t think we are heading for a catastrophic “crash” per se. Rather, I see the housing market continuing strong for at least eight to ten months before we see a significant slowdown and evening out.

Key Takeaways

The bottom line is that there is a property market readjustment coming, but it’ll be quite different from what the United States experienced in 2008. Those circumstances were uniquely reckless and volatile. Though real estate will always be (not crazy about this wording), often at a rapid pace, the market right now is not a castle built on quicksand as it was 13 years ago. As a whole, the nation has learned from these mistakes and is not endorsing overleveraging of buyers. Additionally, construction has slowed for various reasons, most beyond our control, which has naturally put some “brakes” on the market.

The most important takeaway is for potential real estate buyers. As it stands, there is no general advantage to wait. As interest rates fall, housing becomes more affordable at ever-higher prices. If you are in the market for property right now, then buy right now. Simply put, the market will continue to shift and where some pros lessen, others will emerge in your favor. The best move is to hunt for opportunities overlooked by others, so you don’t end up in an impossible bidding war or jump into a property that really isn’t the right fit for you. Don’t get caught up in the manufactured chaos but remain steady in your thinking and purchasing. Most importantly, link arms with a trusted real estate professional who can help you navigate the choppy waters of the market – now and into the future.

What is your take on the current real estate market and the potential for a crash in the future? Do you agree with this prediction or have one of your own to share? Join the conversation by leaving a comment!

[Online Resources] Real Estate, 2008, 2021, agent, analytics, boom, broker, bubble, burst, buyer, buyers agent, central pa, Commercial Real Estate, costs, CRE, data, expenses, harrisburg, interest ratings, land, landlord, local, market, Mike Kushner, national, Omni Realty Group, pennsylvania, pricing, professional, property, property value, regional, renter, report, seller, tenant, tenant representative, trends, united states

Economic Impact of Rising Commercial Construction Costs

Posted on July 14, 2021 by Mike Kushner in Blog, Commercial Real Estate, Local Market, Trends No Comments

When a global pandemic first hit, the main concern was rightfully on the health and wellbeing of our population. As we slowly gained knowledge and tools to bring the spread of this virus under control, something equally as powerful and disruptive was already burning through the economy like wildfire.

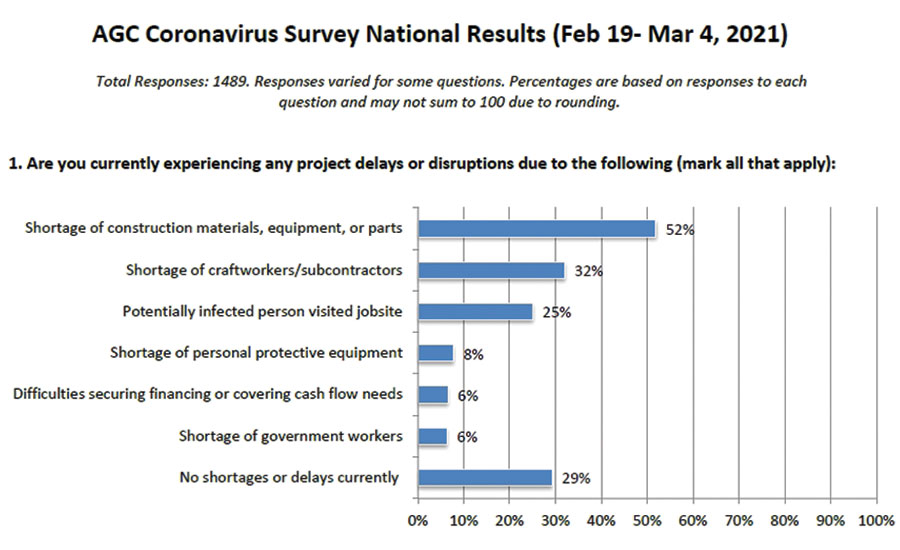
Ongoing pandemic-related disruptions in the supply chain of a range of construction materials are undermining project demand and this has trickled down to impact just about every industry imaginable. Most directly, the delays and cost increases fall on construction businesses, their workers, and their clients who are waiting on them to complete projects varying from a single-family home to mega complexes that have been in the works for years.

These mass shortages caused by the inability to ship or receive some of our economy’s most essential materials, such as lumber and steel, have the construction industry in between a rock and a hard place. And we can be sure that they will not be the only sector to feel the blow of delayed project timelines and skyrocketing costs. How does all of this stand to impact the progress and financial health of our economy? Keep reading for key insights.

Understanding the Impact

According to construction project estimators, one of the biggest reasons for material shortages is the inability to ship available materials by rail or truck. Due to container and trucking shortages being felt across the country, anything with significant shipping and logistics components is highly likely to cause lead time issues. If the easing of tariffs is put into place, pricing and availability should begin to return to normal levels, which would have a positive impact on current projects and the market as a whole. However, with the shipping container and freight backlog that currently exists, bringing in significant quantities of overseas material only adds to the current challenge.

GRAPH COURTESY OF AGC OF AMERICA

Shortages Drive Cost

While general contractors can usually protect against the expectation that costs will increase, the construction industry has not experienced such dramatic material cost increases in recent history. Material cost increases, coupled with the already existing labor and housing shortages, will continue to impact the industry, domestically and globally, for the foreseeable future. Such shortages could delay the start of new projects around the country and may trigger additional claims on projects that are currently underway.

These increases and challenges are cause for concern; it’s important for business owners to consider the types of materials that their project will require. While commercial construction material costs have risen as well, it is not to the extent that residential construction costs rose due to its heavy reliance on softwood lumber. For commercial construction, steel prices generally have a greater impact.

Delays Across the Board

Some material suppliers have completely canceled their bids or contracts due to the lack of materials. While others have indicated delays of six months or more and are currently quoting prices for materials (like engineered wood products) that will not ship until early 2022! Because of these setbacks, the industry can expect an increase in claims and disputes over material prices and associated delays.

Getting Creative with Contracts

Project participants might consider amending their contracts, incorporating new or modified cost-escalation provisions, or adding riders for adjustments to contract terms based on certain material cost increases, such as based on express percentage increases. Parties might also negotiate contract allowances for certain materials or incorporate cost-sharing for material price increases that exceed certain thresholds.

Push On or Wait?

Borrowing is very inexpensive right now, and even a slight increase in lending rates down the road could add hundreds of thousands of dollars in overall costs, depending on the length of the loan agreement. Project owners need to weigh the risks of waiting for material prices to come down against the probability of rising inflation and interest rates. Likewise, if waiting means you can’t expand your production capacity, grow your business, or address the needs of those you serve because of your facility’s limitations, the long-term implications could negate and even overshadow any potential savings.

What’s most important to keep in mind is that the market has demonstrated again and again that everything flows. Trends (and troubles) will come and go, and when the market experiences a negative impact caused by something else, it will look to correct itself almost immediately. To address the delay of construction materials and labor, and the rise in construction costs, as a result, we can see solutions already emerging. These range from using alternate materials, negotiating more flexible terms within a contract, phasing out projects, and getting creative with how and when to borrow money to take advantage of low-interest rates.

The commercial construction industry will rebound, if not even stronger than it was before the pandemic hit. The lesson here is to remain patient, seek innovative and collaborative solutions, and keep your eyes set on the long-term evening-out of any negative impact you may be experiencing today.

[Online Resources] Real Estate, agent, blog, broker, buyers agent, central pa, Commercial Real Estate, Construction, construction industry, CRE, data, economic, Economy, finances, harrisburg, impact, industrial, local, Mike Kushner, money, national, new build, office, omni real estate, Omni Realty Group, regional pennsylvania, retail, space, tenant represenative, trends, united states

Central PA’s Top Commercial Real Estate Leases in 2020

Posted on February 22, 2021 by Mike Kushner in Blog, Commercial Real Estate, Industrial, Local Market, Office Leasing, Trends No Comments


In spite of 2020’s black swan event (COVID-19), leasing activity in Central Pennsylvania continued with mixed results. Normally insulated from strong economic downturns, the coronavirus tested the Central Pennsylvania Region and there are reasons for both concern and optimism.

On the negative side: massive job losses in retail and a significant manufacturing base could cause serious disruption. Roughly 30,000 people were employed in the retail sector in March, and close to that number were also employed in manufacturing. Though manufacturing’s future remains less clear and the market could be buoyed by the region’s deep presence of food production, retail has been hard hit by the shutdown.

While being the state’s capital will provide some shelter in the coming months, Pennsylvania’s fiscal situation is a mess. Financial troubles could portend future government layoffs and by the third quarter, the state had already cut 2,500 government jobs.

There’s little chance the economy doesn’t cool in Central Pennsylvania but the market does have some factors working in its favor. BLS data shows the market has lost about 5% of its total non-farm employment levels since March. While this is obviously a significant reduction, it does compare well with nearby Lehigh Valley and Pittsburgh. While Harrisburg’s demographic gains won’t raise any eyebrows, the region does stand out in Pennsylvania. Cumberland County is one of the fastest-growing counties in the state, likely aided by the growing logistics and warehouse presence along the Carlisle Corridor.

The logistics sector is expected to hold up well and perhaps even grow as e-commerce continues its acceleration. An Adobe report from June showed that online spending was up 77% year over year, representing growth in e-commerce that experts were not forecasting the country to reach until 2026. Central Pennsylvania’s location is prime for shipping, and such a scenario could lead to more jobs and perhaps fuel additional growth in population.

Additionally, Central Pennsylvania is also trying to evolve into a knowledge-based economy and has adopted business-friendly incentives that have helped create nearly two dozen tech startups, which have generated 1,000 jobs. Education and health services jobs, which now track evenly with government jobs in the state’s capital, grew by more than 4% annually.

How does the ever-shifting economy impact the commercial real estate market, particularly as it pertains to commercial leases?

It comes as no surprise that industrial real estate leases in 2020 carried the largest square footage, with the top lease coming in at more than 1.1M SF to Lowes Distribution Center in Shippensburg. Additionally, Bob’s Discount Furniture will be moving into the former Best Buy in Lancaster, and Hershey will be getting a new Big Lots in the Hershey Square Shopping Center. The top five flex leases also provided businesses with hundreds of thousands of Class B Flex Space. Keep reading to view the top 5 leases from 2020 for office, retail, industrial, and flex space.

Top 5 Office Leases

#1 – 1929 Lasalle Ave – Bldg 134, Lancaster, PA 17601

High Associates Ltd. leased out the 29,000 SF Class C Office Building built in 1974 to Equipment Depot beginning in January of 2020 for a 1-year term. It had previously been vacant for 164 months.

#2 – 1803 Mt Rose Ave – Bldg B, York, PA 17403

Kinsley Properties leased out the 23,704 SF Class C Office Building built in 1988 to IDS, LLC beginning in February of 2021 for a 5-year term. It had previously been vacant for 13 months.

#3 – 990 Peiffers Ln – NRG Engine Services, Harrisburg, PA 17109

Campbell Commercial Real Estate leased out the 23,382 SF Class B Office Building built in 1987 to UPS Midstream Services Inc. beginning in February of 2020 for an unspecified term.

#4 – 1770 Hempstead Rd – Greenfield Corporate Center, Lancaster, PA 17601

High Associates Ltd. leased out the 16,088 SF Class B Office Building built in 1990 to an unnamed leasee beginning in November of 2020 for unspecified term. It had previously been vacant for 19 months.

#5 – 200 Corporate Center Dr – 200 Corporate Center Dr, Camp Hill, Camp Hill, PA 17011

Cushman & Wakefield leased out the 11,655 SF Class A Office Building built in 1986 to an unnamed leasee in August of 2020 for an unspecified term. It had previously been vacant for 52 months.

Top 5 Retail Leases

#1 – 3975 Columbia Ave, Columbia, PA 17512

The 86,100 SF Class B Retail Building built in 1992 was leased to U-Haul, as the single tenant, beginning in June of 2021.

#2 – 1801 Hempstead Rd – Former Best Buy, Lancaster, PA 17601

Bennett Williams Commercial and ShopCore Properties leased out the 45,915 SF Class B Retail Building built in 2009 to Bob’s Discount Furniture beginning in September of 2020 for a 10-year term. It had previously been vacant for 23 months.

#3 – 921 E Main St – Mount Joy Square Shopping Center, Mount Joy, PA 17552

Bennett Williams Commercial leased out the 44,761 SF Class B Retail Building built in 1989 to an unnamed business beginning in March of 2021. It had previously been vacant for 25 months.

#4 – 1130-1170 Mae St – Hershey Square Shopping Center, Hummelstown, PA 17036

Bennett Williams Commercial leased out the 38,202 SF Class B Retail Building built in 1994 to Big Lots beginning in June of 2020 for a 10-year term. It had previously been vacant for 12 months.

#5 – 4075 E. Market St – York, PA 17402

The Flynn Company leased 27,000 SF Class C Industrial/Manufacturing Building built in 1972 to No Piston, LLC beginning in October of 2020 for a 5-year term.

Top 5 Industrial Leases

#1 – 1 Walnut Bottom Rd – Shippensburg 81 Logistics Center, Shippensburg, PA 17257

Colliers International leased out the 1,100,500 SF Class A Industrial Building completed in 2020 to Lowes Distribution Center beginning in February of 2021. It had previously been a vacant shell space for 160 months.

#2 – 200 Goodman Dr – Building 2, Carlisle, PA 17013

CBRE leased out the 938,828 SF Class A Industrial Building built in 2017 to Syncreon beginning in December 2020. It had previously been vacant for 44 months.

#3 – 951 Centerville Rd – Penn Commerce Center – Building A, Newville, PA 17241

Cushman & Wakefield leased out the 807,998 SF Class A Industrial Building to an unnamed leasee. It had previously been vacant for 5 months.

#4 – 4875 Susquehanna Trl – ES3 LLC Bldg 1, York, PA 17406

The 790,042 SF Class B Industrial Building was leased to ES3, a Professional, Scientific, and Technical Services company, beginning in February 2020 for an unspecified term.

#5 – Centerville Rd – Penn Commerce Center – Building B, Newville, PA 17241

Cushman & Wakefield leased out the 753,000 SF Class B Industrial Building to an unnamed lease beginning on January 2021. It had previously been vacant for 3 months.

Top 5 Flex Leases

#1 – 60-64 Industrial Rd, Elizabethtown, PA 17022

Cushman & Wakefield leased out the 113,720 SF Class B Flex Space completed in 1992 to WillScot beginning in September of 2020. It had previously been a vacant shell space for 13 months.

#2 – 1740 Hempstead Rd – Building 380, Lancaster, PA 17601

High Associates, Ltd. leased out the 34,000 SF Class B Flex Space completed in 1964 to an unnamed business beginning in January of 2021. It had previously been a vacant shell space for 92 months.

#3 – 6400 Flank Dr, Harrisburg, PA 17112 – Harrisburg Area East Ind Submarket

NAI CIR leased out the 32,212 SF Class B Flex Space completed in 1987 to an unnamed business beginning in June of 2020. It had previously been a vacant shell space for 3 months.

#4 – 1000 Kreider Dr – Building A, Middletown, PA 17057

CBRE leased out the 12,030 SF Class B Flex Space completed in 2006 to an unnamed business beginning in August of 2020. It had previously been a vacant shell space for 8 months.

#5 – 3545 Marietta Ave – Silver Spring Center, Lancaster, PA 17601

Prospect Leasing & Management leased out the 7,192 SF Class B Flex Space completed in 1997 to an unnamed business beginning in January of 2021 for a 5-year term. It had previously been a vacant shell space for 6 months.

With so much square footage having exchanged hands in Central PA in 2020, it will be interesting and important to keep an eye on how these businesses impact the region. There were quite a few properties that made it to this list that had sat vacant for years. Now with new tenants, this will drive jobs and contribute to the local economy. And with some of these leasing terms for 5, even 10 years, these businesses have made a commitment to being here long-term.

Among all the top leasing deals that took place in 2020, which sector – office, retail, industrial, or flex – do you think will have the largest and most immediate impact on the Central PA region? Share your thoughts by leaving a comment below.

*Data of the top commercial real estate sales provided by CoStar.

[Online Resources] Real Estate, business, carlisle, Commercial Real Estate, costar, CRE, data, deal, development, Economy, gettysburg, growth, hanover, hershey, jobs, lancaster, lease, Leasing, lebanon, mechanicsburg, Omni Realty Group, pennsylvania, property management, retailers, tenant representative, trends, warehouse, york

Why Banks are Cutting Back on Commercial Real Estate Lending

Posted on January 17, 2020 by Mike Kushner in Commercial Real Estate, Construction, Guest Blogger, Local Market, Trends No Comments

Commercial real estate lending, the bread-and-butter business for many smaller and regional banks, could further decrease in 2020. The cause is a combination of a few different factors – intense competition from non-bank lenders and rising delinquency rates to name a few. Mortgage lending is also predicted to be impacted by rising interest rates and tight housing supplies in many major markets.

This trend is not new, but rather has been slowly creeping in for years. In 2017, U.S. banks reported that demand for commercial real estate loans weakened in the second quarter, though foreign banks reported strengthened demand. Furthermore, loan growth slowed to 4.2 percent in 2018, down from 5.6 percent in 2017, according to bank call reports and Federal Deposit Insurance Corp. data.

Why exactly are banks cutting back on commercial real estate lending? And should this call for concern that a potential economic downturn is in the near future?

Rory Ritrievi, President and CEO of Mid Penn Bank

To lend some expertise on this topic, Omni Realty Group turned to Rory Ritrievi. Rory has more than three decades of experience in banking, specifically in Pennsylvania. For the last 11 years, Rory has served as President and CEO of Mid Penn Bank. Under his direction, the bank has grown from $550 million in assets and 14 retail locations to over $2 billion in assets and 39 retail locations.

Throughout his banking career, Rory has gained deep insight into when and why banks provide commercial real estate loans – and when they do not. Let’s learn what he thinks is going on in the current market, and the pending economic impact.

Omni Realty: How has commercial lending changed in the last 5 years?

RR: In the last 5-10 years, we have seen, for the most part, a return to credit fundamentals that seem to have been abandoned in the years leading up to the Great Recession. Back then it seemed like almost any deal made sense to Bankers. Now, the focus has been returned to analysis of absorption rates, discounted cash flows, borrower experience, reasonable cap rates, and strength of guarantors.

Omni Realty: In your opinion, what are the main causes of these changes?

RR: Losses. Loan losses of 2008-2012 gave a renewed focus to bankers on the true meaning of credit fundamentals.

Omni Realty: What changes would need to take place in the commercial estate market, or economy as a whole, to further improve commercial lending?

RR: Lenders need to evolve their underwriting and analytics to keep up with the evolving demographics. Baby Boomers are aging out so there is a need for more senior housing, multifamily rentals, luxury apartments, and assisted living. Additionally, high student loan balances are making the need for affordable housing in urban areas more prevalent. There is also a growing focus on renewable energy and green spaces. Finally, work from home is more prevalent which challenges the demand for traditional office space. When we look to retail, the shift toward online decreases the demand for mall space, while increasing demand for warehouse space. And we can’t overlook technology. Bankers need to not only know about emerging technology that stands to impact the market, but they must embrace it as a highly valuable tool to help them “keep up.”

Omni Realty: What do you anticipate the trend to be for commercial lending in 2020?

RR: In my opinion, 2020 will be a positive year in the lending business, particularly in Central Pennsylvania. We are in a good credit cycle and the interest rate yield curve is in decent shape compared to last year. There are geopolitical issues such as the impact of the general election, instability in the Middle East, and trade with China but I do not believe any of those issues will halt the progress of our local economy in 2020. Challenge it, yes and maybe slow it a bit, but not halt it entirely.

Omni Realty Group thanks Rory for sharing this valuable information and helping us to further understand the factors impacting how banks view commercial lending. Though banks are, for the most part, treading lightly in the market since the Great Recession, it’s encouraging to hear their renewed commitment to credit fundamentals, and helping both individuals and businesses make well-educated lending decisions.

Amidst a year that will no doubt bring change, it’s important we remain aware of the lasting impact factors such as elections and geopolitical issues may bring to our economy, both immediately and for years to come. Rory provides sound reason as to why we should not fear such changes, but rather maintain confidence in the banking economy, particularly here in Central Pennsylvania.

Do you agree with these insights, or have others to share? We welcome your feedback in the comments below!

[Online Resources] Real Estate, analysis, banks, blog, building, camp hill, carlisle, central pennsylvania, commercial lending, commercial loans, Commercial Real Estate, Construction, construction loans, CRE, data, Economy, finances, gettysburg, guest blogger, harrisburg, hershey, industrial, lancaster, lemoyne, lending, loans, market, mechanicsburg, mid penn bank, Mike Kushner, money, new cumberland, office, Omni Realty Group, pennsylvania, retail, Rory Ritrievi, trends, united states, york

How Central PA’s Growing Population Impacts Local Businesses

Posted on October 25, 2019 by Mike Kushner in Blog, Local Market, Trends No Comments

According to a 2018 report from the Pennsylvania Data Center, Pennsylvania’s population is expected to grow approximately 1% from the 2010 to the 2020 population, which is 1% better than no growth or a loss. What’s even more remarkable, is Pennsylvania’s growth is focused in about 16 counties, 14 of which are in Pennsylvania’s South Central Region, South East Region and Lehigh Valley, including Pennsylvania’s fastest growing county population in our own Cumberland County, here in South Central PA.

Furthermore, estimated population growth in those 14 counties is about 3.8%, which is driving Pennsylvania’s overall modest population growth, while counties in Pennsylvania’s West and Northern Tier are losing population with only Butler and Centre Counties showing expected population growth.

All of this data raises a very important question…

How does Central Pennsylvania’s changing population stand to impact the economic development of our local businesses?

To help answer this, we asked David Black, President and CEO of the Harrisburg Regional Chamber and CREDC, to weigh in from his perspective and the changes he is seeing taking place in Central Pennsylvania. Here is what he shared.

***

Focusing on South Central Pennsylvania, which includes Adams, Cumberland, Dauphin, Franklin, Lancaster, Lebanon, Perry and York, it’s pretty good news for us. Population growth drives demands for products, services and community amenities – quality of life factors. The quality of life factors – everything from good restaurants, entertainment, quality public education, exceptional health care, transportation access and cost of living – are in part driven by more people paying more taxes and needing more services that feed into our positive economic cycle.

Given our region’s transportation advantage via highways, rail and air and other amenities, South Central Pennsylvania is a great place to live, raise a family and have fun, plus we are close enough that if large metros like Washington, Baltimore, Philadelphia or New York is your thing, just a few hours will get you there. Quality of life issues help to attract and retain workforce, which is the business community’s number one issue these days, due largely to the fact that 10,000 baby boomers nationwide are retiring each and every day, leaving workforce challenges in many industries.

People want to live in vibrant communities. Some people prefer urban lifestyles, some are suburbanites while still others prefer the more natural rural lifestyles. Guess what? South Central Pennsylvania has it all. You can live on your 10 acres in Perry County and be to work in 30 minutes in downtown Harrisburg or walk to your job in center city Harrisburg from your apartment downtown, or your own home in Midtown, or commute 10 or 15 minutes from your suburban community to your job.

Population growth helps to drive business growth, it helps to drive additional growth in our region. While we think of ourselves as Harrisburg or Lancaster or York, commuting patterns show us that people commute from county to county to work because they can. I have a theory, with no disrespect to Lebanon County, that everyone in the Palmyra area actually works in Dauphin County at someplace with Hershey in the name! Businesses provide jobs, but people with the ability to spend drive local economies while our strategic location and transportation advantage help to connect us to the global economy and make South Central Pennsylvania such a special place to call home.

***

To offer additional insight, specifically on working age population growth in Pennsylvania, we asked Ben Atwood of CoStar, a national commercial real estate research firm.

***

One of Costar’s recent articles entitled “Latest Census Data Shows Lehigh Valley Leading Pennsylvania in Working-Age Population Growth” stated that the latest data from the Census Bureau shows Pennsylvania continues struggling to lure in new industries and working age residents. The U.S. population aged 20-64 increased by 0.25% last year, but of Pennsylvania’s 67 counties, only seven surpassed this growth rate and 55 experienced net declines.

Harrisburg and its satellite markets are pretty underdeveloped (excepting Lancaster), relatively speaking. And the lack of modern office supply and relatively stagnant population growth means there likely won’t be major companies relocating into the area. Right now, that capital investment would have to be largely local, and how much are people locally willing to risk?

Central PA is in the position to grow in ways other areas in the state aren’t, but that doesn’t mean that growth will be rapid, or even guaranteed. The new developments will be riskier, hampering investor interest. This combined with stagnant, even waning growth in working age population can be cause for concern both near and long-term.

To some extent, the optimism about population growth is misplaced because it could just mean these areas will have a slightly easier go of it over the next few decades, as automation continues to eat away at blue collar jobs in retail, shipping, and professional services in the Commonwealth’s smaller markets.

Things change and evolve, and no one can predict the future, but a lot of growth in these areas is in transportation and manufacturing, industries with long term automation risks, and there’s plenty of reasons to believe automation will expand into white collar employment in the near future.

***

Omni Realty Group is very grateful for David and Ben’s expertise and input. It’s fascinating, yet not surprising that population growth can have such a profound impact on quite literally everything else. Here in Central Pennsylvania we have a valuable opportunity to harness this growth and use it to fuel our economy. This further emphasizes the point that there are many unique benefits to live, work, and play in this region. Whether you call Central Pennsylvania home, are employed in the region, or simply enjoy visiting to experience its social offerings, you are playing an important role in the growth of our economy.

How else do you feel that our region’s changing population stands to impact local businesses? Join in the conversation by leaving a comment below.

[Online Resources] Real Estate, analysis, ben atwood, blog, business, carlisle, census, central pa, central pennsylvania, Commercial Real Estate, costar, CRE, data, david black, development, Economy, growth, guest blogger, harrisburg, Harrisburg regional chamber, hershey, lancaster, local, market report, Omni Realty Group, pennsylvania, population, real estate broker, regional, tenant representative, trends, york

Census Data: National and Local Trends You Need to Watch

Posted on June 3, 2019 by Mike Kushner in Blog, Commercial Real Estate, CPBJ Articles, Local Market, Trends No Comments

Note: This article was published by the Central Penn Business Journal. Click here to read the original version.


Census data provides a fascinating look into population growth trends that stand to have a profound impact on our economy, both locally and nationally. More than just being “interesting” data to study, population growth and decline points us to important trends that will reshape supply and demand in various industries, one of the most prominent being real estate.

Just last month, the US Census Bureau released new population estimates. These estimates account for and compare the resident population for counties between the dates of April 1, 2010 to July 1, 2018. The outcome? There are shifts in population taking place across the nation that may differ from what you might assume. Let’s take a look at some of the highlights from this data from a national and local level.

At a National Level

South and West Lead Population Growth

The census data confirmed that counties with the largest numeric growth are located in the south and the west regions. In fact, Texas claimed four out of the top 10 spots. Looking at population growth by metropolitan area, Dallas-Fort Worth-Arlington, Texas, had the largest numeric growth with a gain of 131,767 people, or 1.8 percent taking place in 2018. Second was Phoenix-Mesa-Scottsdale, Arizona which had an increase of 96,268 people, or 2.0 percent. The cause of growth in these areas is the result of migration, both domestic and international, as well as natural increase. In Dallas, it was natural increase which served as the largest source of population growth, whereas in Phoenix I was migration.

Fastest Growth Occurred Outside of Metropolitan Areas

Surprisingly, no new metro areas moved into the top 10 largest areas. Of the 390 metro areas within the US (including the District of Columbia and Puerto Rico), 102 of these areas, or 26.2 percent experienced population decline in 2018. The five fastest-decreasing metro areas (excluding PR) were Charleston, West Virginia (-1.6 percent); Pine Bluff, Arkansas. (-1.5 percent); Farmington, New Mexico (-1.5 percent); Danville, Illinois (-1.2 percent); and Watertown-Fort Drum, New York (-1.2 percent). The population decreases were primarily due to negative net domestic migration.

North Dakota Claims Fastest Growing County

Among counties with a population of 20,000 or more, Williams County, North Dakota claimed the top spot as the fastest-growing county by percentage. This county increased by 5.9 percent between 2017 and 2018 (from 33,395 to 35,350 people). The rapid growth Williams County experienced was due mainly to net domestic migration, 1,471 people, in 2018. The county also experienced growth between 2017 and 2018 by both natural increase of 427 people, and international migration of 52 people.

More Growth than Decline

Out of 3,142 counties, 1,739 (or 55.3 percent) gained population between 2017 and 2018. Twelve counties (0.4 percent) experienced no change in population, and the remaining 1,391 (or 44.3 percent) lost population. Between 2010 and 2018, a total of 1,481 (or 47.1 percent) counties gained population and 1,661 (or 52.9 percent) lost population. Though there has been more growth than decline overall, the numbers indicate that this can easily shift year over year.

At a Local Level

Dauphin County

 Lancaster County

York County

Cumberland County

Cumberland, Dauphin, Lancaster and York Experience Consistent Growth

The most notable trend to take place between 2010 and 2018 in Central PA is that these counties all experienced consistent growth year-over-year. Moreover the growth occurred fairly evenly over the last 8 years. This provides consistency and enables the economy to respond to the growth over a reasonable amount of time.

Counties Also Maintain Same Order of Ranking in Population

Another trend worth noting is that the counties have maintained the same order of ranking based upon population for 8+ years. For example, in 2010 these counties in order of smallest population to largest population was Cumberland, Dauphin, York, Lancaster. This is the same ranking we see in 2018, and every year in between. No county surpassed another at any point.

Lancaster Remains Largest and Fastest Growing County

Lancaster County has a major lead in population over the others. At 984 square miles, it is also the largest of the 4 counties. Between 2010 and 2018 it also experienced the largest numeric growth at 24,112 people. Number two in numeric growth was actually the smallest of the four counties, Cumberland County, which grew by 16,017 people. York County grew by 13,301 people and Dauphin County grew by 8,997 people.

Overall, the latest US Census offers valuable and insightful information related to population growth between 2010 and 2018. Understanding the cause of either growth or decline provides framework for how these shifts may continue on their course, or change in the future.

A deeper dive into the census data reveals several demographic changes impacting commercial real estate development: household formations, aging baby boomers, growing millennials, women in the workforce, and migration toward the South.

Today’s demographic changes present challenges for commercial real estate developers, but they also offer lucrative opportunities to firms creatively adapting to new demands.

[Online Resources] Real Estate, 2018, america, analysis, blog, blogger, camp hill, carlisle, census, census bureau, central pa, central penn business journal, change, Commercial Real Estate, cumberland, data, dauphin, decline, facts, growth, harrisburg, hershey, homes, hummelstown, increase, information, lancaster, lemoyne, local, local market, migration, Mike Kushner, nation, national, pennsylvania, population, real estate agent, real estate broker, residential, statistics, trends, united states, york

High Rental Rates, Low Vacancy Define Central Pennsylvania Industrial Market

Posted on August 27, 2018 by Mike Kushner in Blog, Industrial, Local Market, Trends No Comments

Central PA’s submarket clusters for industrial real estate have some of the lowest vacancy rates and highest rental rates we have seen in recent years.

It’s the news that every commercial real estate developer and investor want to hear – the industrial real estate market in Central Pennsylvania ended Q2 2018 with some of the highest rental rates and lowest vacancy rates the market has experienced since 2014.

Now, it hasn’t been a steady climb over the last four years. Rather there’s been quite a bit of volatility in the market, with numbers bouncing up and down and up and down. However, it does appear that the extreme peaks and valleys have evened out and a more stable, yet steadily growing industrial real market has emerged in Central PA – at least for the present moment.

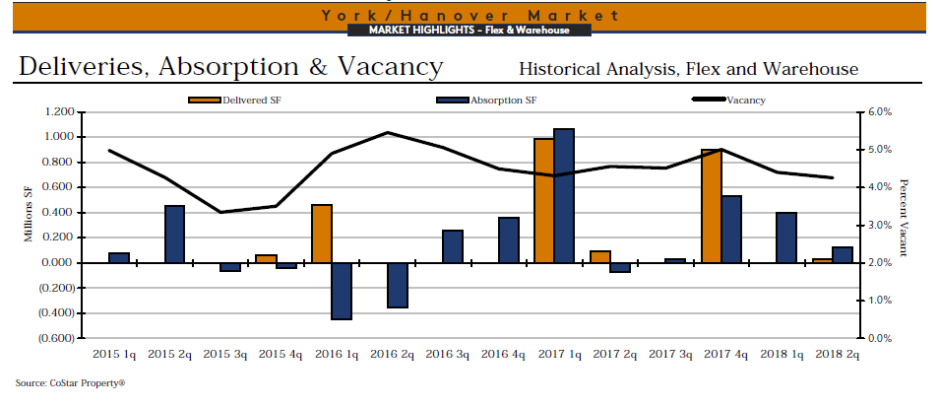
Let’s take a closer look at some of the most interesting trends and numbers reported from CoStar’s Q1 2018 report for Harrisburg/Carlisle, Lancaster and York/Hanover Submarket Clusters.

Harrisburg/Carlisle Submarket Cluster

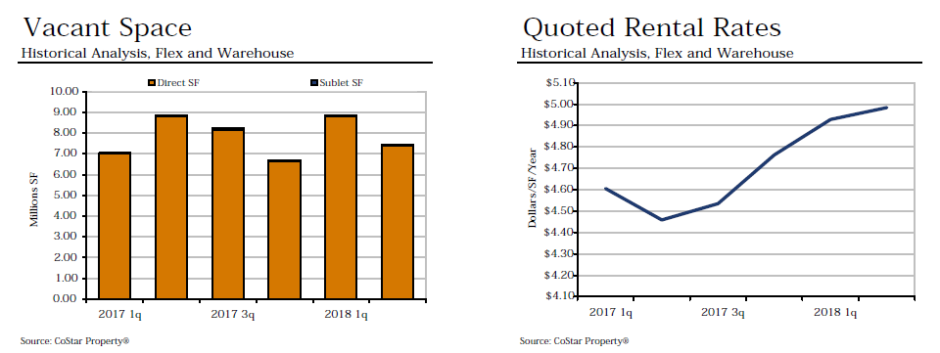
Vacancy – The industrial vacancy rate for the Harrisburg/Carlisle Submarket Cluster fell significantly from Q1 2018 where it was previously 9.4% to its now 7.9%. This is the largest drop between a single quarter that the market has seen since prior to Q3 2014. In fact, starting with Q2 2017, the industrial vacancy rate for the Harrisburg/Carlisle Submarket Cluster has been quite volatile, swinging up and down by sometimes more than one percentage point in a quarter.

Absorption – The pattern of volatility in the Harrisburg/Carlisle Submarket Cluster continues with its net absorption. Though the market ended 2017 at a positive 2,692,866 square-feet, in Q1 2018 this dropped to a negative (2,132,086) square-feet, mostly due to a single building of 1,100,000 square-feet that was delivered that same quarter. Now in Q2 2018, net absorption is back in the positive at 1,385,445 square-feet with no new buildings delivered this quarter.

Rental Rates – The average quoted asking rental rate for available industrial space is $4.98. This has been steadily increasing ever since it experienced a drop in Q2 2017 where it dropped from $4.61 to $4.46 in one quarter. Now at almost $5.00 per square foot of space, the Harrisburg/Carlisle Submarket Cluster’s rental rates for industrial space is the highest it has been since prior to Q3 2014.

Inventory – As mentioned above, no new buildings were delivered this quarter, or in all of 2018. Three buildings are currently under construction, totaling 2,951,468 square-feet of new space. It’s estimated that these properties will not be delivered until early 2019.

Lancaster Submarket Cluster

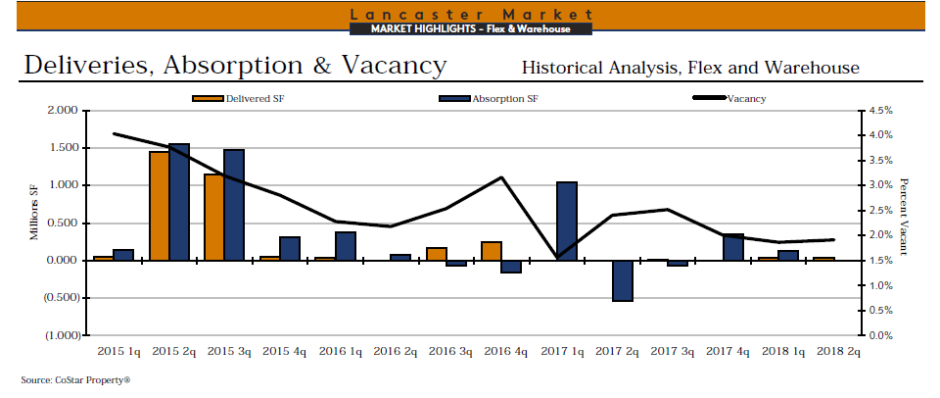
Vacancy – The vacancy rate for the Lancaster Submarket Cluster in Q2 2018 held steady at 1.9%, the same as it was in Q1 2018. In fact, it has changed minimally from the 2.0% that Q4 2017 ended with. Previous to these last three quarters, there has been a lot more change from quarter to quarter in the Lancaster Submarket Cluster’s vacancy rate. To be this low, and this consistent for three quarters indicates a stable market with supply and demand near evenly matched.

Absorption – As for net absorption, Q2 2018 ended with a positive 2,723 square-feet. This is a drop of 127,888 square feet from Q1’s net absorption of 130,611 square-feet. After experiencing two quarters of negative net absorption in Q2 and Q3 2017, and rebounding to positive 354,056 square-feet in Q4, this is now the third quarter that net absorption has continued to drop, though still a positive number – for now.

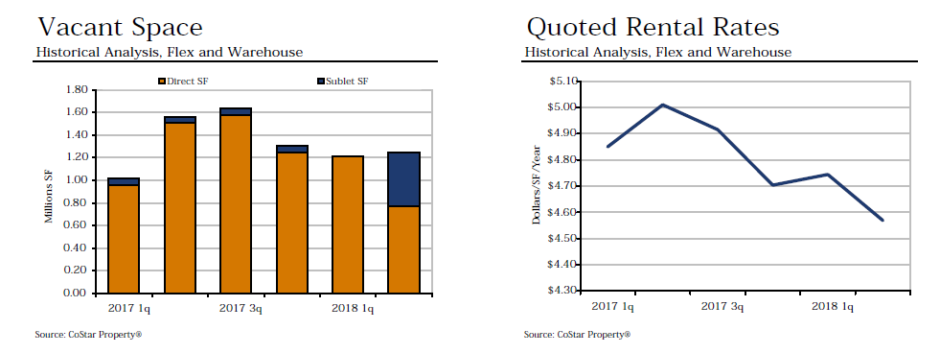
Rental Rates – The quoted asking rental rate for available industrial space in the Lancaster Submarket Cluster took a hit this quarter when it dropped from $4.74 to $4.57 per square foot. The trend in rental rates have been up and down and up and down over the course of the last four years. While it peaked at $5.15 per square foot in Q4 2016, it has never been able to return to that high and is now trending downward, inching closer to the numbers we saw in early 2015.

Inventory – One new building was delivered this quarter, adding 35,768 square-feet of new space to the industrial market. There are no other buildings currently under construction in the Lancaster Submarket Cluster.

York/Hanover Submarket Cluster

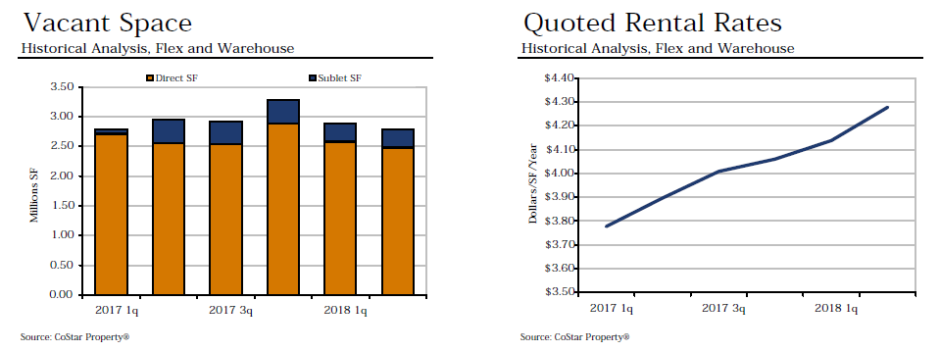
Vacancy – The industrial vacancy rate for the York/Hanover Submarket Cluster dipped ever so slightly this quarter from 4.4% in Q1 2018 to its current 4.3%. This is the lowest vacancy has been in over a year when it was also 4.3% in Q1 2017. From that point, the vacancy rate was on the rise, peaking at 5.0% in Q4 2017, then dropping 0.6% points to 4.4% in Q1 2018.

Absorption – Q2 2018 ended with a net absorption of 125,766 square-feet.  Looking at Q1’s net absorption of 396,112 square-feet, this is a drop of 270,345 square-feet in a single quarter. Between these two quarters only one new building of 30,000 square feet was delivered to the market.

Rental Rates – The Lancaster Submarket Cluster ended Q2 2018 with a quoted asking rental rate of $4.28. This is $0.14 higher than it was in Q1 and $0.22 higher than in Q4 2017. In fact, this is the highest rental rate this submarket cluster has seen since prior to Q3 2014 with it near steadily rising during that entire period.

Inventory – Only one new building was delivered in Q2 2018 and that added 30,000 square-feet of industrial space to the market. There are currently no new buildings under construction at this time.  

Key Takeaways

Given all the activity taking place in the various Central PA submarket clusters, there are particular insights that are important to note. First, we can expect vacancies to remain at record lows for the remainder of 2018, despite a further uptick in new construction. Additionally, E-commerce sales grew 15.2% in Q2 2018, compared with the same time last year and now represent 9% of total sales. E-commerce will continue to be a driving force in the foreseeable future.

While indicators point to strong demand, there are headwinds increasing from labor shortages and tariffs. With the economy at or near full employment, site selection decisions and supply chain nodes may be driven out to secondary and tertiary markets. Finally, it is too early to predict the exact impact of tariffs on the industrial market, but we can look for potential declines in import and export levels.

Looking at the comparison of the three Central Pennsylvania submarket clusters, which do you feel has the strongest industrial real estate market right now? What changes do you anticipate taking place throughout the rest of 2018?

Share your ideas by leaving a comment below!

[Online Resources] Real Estate, absorption, central pa, Commercial Real Estate, costar, data, developer, industrial, inventory, investor, manufacturing, market, Mike Kushner, Omni Realty Group, pennsylvania, rental rates, report, space, statistic, trends, warehouse

10 Facts Any Commercial Real Estate Investor Should Know about Central PA’s Industrial Market

Posted on April 30, 2018 by Mike Kushner in Blog, Commercial Real Estate, Industrial, Local Market No Comments

10 Facts Any Commercial Real Estate Investor Should Know about Central PA’s Industrial Market

Central PA’s industrial real estate market is unique for a variety of different reasons. Taking into consideration its geographic, demographic and economic factors, we’ve compiled a list of what we feel are the most important facts worth knowing about our local industrial market.

If you are a commercial real estate investor, or simply someone who wants to know more about Central Pennsylvania’s commercial real estate market, you are sure to find this list of top 10 facts both valuable and interesting. Let’s take a look!

  1. Harrisburg-York-Lebanon CSA is 3rd most populous in PA and 43rd most populous in U.S.

The Harrisburg-York-Lebanon Combined Statistical Area (CSA) is made up of six counties and includes four metropolitan areas in Central Pennsylvania. In 2010, the CSA’s population was 1,233,708 people, making it the 3rd most populous CSA in PA and the 43rd most populous CSA in the U.S. The Harrisburg-York-Lebanon CSA includes the following Metropolitan Statistical Areas (MSAs): Harrisburg-Carlisle, Lebanon, Gettysburg and York-Hanover.

  1. Harrisburg area puts up strong competition against Lehigh Valley.

Though Lehigh Valley is commonly recognized as Pennsylvania’s leader in warehousing and distribution, Harrisburg delivered only 600,000 SF less than Allentown in 2017, while also generating roughly the same rent growth. Additionally, companies such as Whirlpool, Amazon, Ace Hardware, FedEx, Kohler, and Lindt Chocolates have set up large-scale warehouse and distribution centers in Harrisburg – and those tenants account for just a portion of more than 16 million SF of net absorption.

  1. Harrisburg-Carlisle and Lancaster Ranked Among Leaders in National Job Growth

Of the 25 metro areas with the fastest job growth, as of August 2017, both Harrisburg-Carlisle and Lancaster placed on this competitive list. Lancaster ranked number 24 for its steady growth as it diversifies its economy and renovates its downtown and industrial areas. In six months Lancaster added 3,100 new jobs, bringing its total employment to 252,400 and 2017 growth rate to 1.23%. Harrisburg-Carlisle ranked number 8 on the list with 6,200 new jobs added in the first two quarters of 2017, bringing total employment to 346,100 and 2017 growth rate to 1.82%. Noted was the area’s diverse group of healthcare, technology and biotechnology businesses.

  1. Prime location for warehousing and distribution.

Central Pennsylvania is a premiere market for industrial space for several compelling reasons. For businesses who need easy and affordability storing and shipping of products, the areas offers a great roadway system, an abundant work force, relatively inexpensive and available raw land, and the ability to reach 70 to 80 percent of the U.S. population in 24 hours. Additionally, our government regulations on warehousing and distribution are comparatively easy and straightforward compared to other nearby states or regions.

  1. Four of the 10 Select Top Industrial Leases in Q4 2017 took place in the Harrisburg market.

According to CoStar’s Q4 report for 2017, Harrisburg east and west markets represented the majority of top industrial leases signed that year. Prologis Carlisle (1,029,600 SF), Goodman Logistics Center Carlisle (1,007,868 SF), Prologis Harrisburg (623,143 SF) and Carlisle Distribution Center (575,000 SF) were all leased to different businesses who were looking to grow their industrial real estate space in Central Pennsylvania. This activity indicates economic growth and interest in Central PA’s industrial real estate market, both from businesses and real estate investors.

  1. Lancaster market has the highest quoted rental rate for industrial space in Central PA at $4.69 per SF.

Even though Lancaster’s quoted rental rate for industrial space decreased by $0.45 per SF than where it was at the end of Q4 2016, it still comes in higher than Central PA’s other surrounding submarkets. At $4.69 per SF, Lancaster is $1.41 per SF higher than Lebanon, $0.03 per SF higher than Harrisburg/Carlisle, $0.08 per SF higher than Gettysburg and $0.67 per SF higher than York/Hanover based on Q4 2017.

  1. Lancaster also has the lowest vacancy rate for industrial space in Central PA at just 2.0%.

Lancaster ended Q4 2017 with the lowest vacancy rate of all surrounding submarkets. Compared to Lancaster’s vacancy rate of 2.0%, Lebanon came in at 15.8%, Harrisburg/Carlisle at 6.8% and York/Hanover at 4.9% based on Q4 2017. Though Gettysburg did end 2017 with a vacancy rate of 0.4%, it’s important to note this submarket has just 78 buildings with a combined 4,372,179 SF of existing inventory which places it at a much different level than the other submarkets, comparatively.

  1. Within the MSA, Harrisburg/Carlisle has the largest SF of industrial space under construction at 1,813,468 SF.

Two significantly large industrial projects will soon result in the addition of 1,813,468 SF to the Harrisburg/Carlisle submarket. Comparatively, Lebanon has three buildings under construction with a combined 1,310,195 SF of space, Lancaster has two buildings under construction with a combined 76,486 SF of space, York/Hanover has two buildings under construction with a combined 895,000 SF of space and Gettysburg has no new industrial space under construction. For Central PA as a whole, that equals 4,095,149 SF of new industrial space that will soon be delivered to the market.

  1. Harrisburg/Carlisle’s ended 2017 with a positive net absorption of 2,700,108 SF.

According to CoStar’s Q4 2017 industrial market report, Harrisburg/Carlisle ended the year with the highest, positive net absorption we’ve seen since prior to 2014. At 2,700,180 SF, this is significantly higher than any other quarter that year, especially Q2 where the net absorption dropped to negative 499,576 SF. Additionally is Q4 2017, one new building was delivered to the market, adding 1,100,000 SF of space. Even with this influx of inventory, the net absorption rose by 2,083,756 SF. The new building that was delivered is Whirlpool’s new distribution facility located at 100 Fry Drive, Mechanicsburg.

  1. Influx of State and Federal dollars will continue to improve transportation in and around Central PA.

The Trump administration has recently been touting a $1.5 trillion, 10-year public-private plan to improve roads, bridges, ports and other infrastructures across the nation. Central Pennsylvania has plans to utilize some of this federal funding to bolster its priority projects which include fixing structurally deficient bridges and widening interstates. Improvement to our roadways and infrastructure will improve public safety, create construction jobs and make Central PA an even more attractive location for warehousing and distribution.

After reading through these top 10 facts any commercial real estate investor should know about Central PA’s industrial market, you are likely to have some comments or questions of your own.

Start a discussion by leaving a comment below!


[Online Resources] Real Estate, camp hill, carlisle, central pa, central pennsylvania, commercial, Commercial Real Estate, costar, CRE, data, distribution, harrisburg, hershey, hummelstown, industrial, information, investment, investor, lemoyne, list, mechanicsburg, Mike Kushner, msa, Omni Realty, pennsylvania, research, statistics, top 10, trends, trucking, warehouse

Central Pennsylvania Industrial Real Estate Report for Q2 2017

Posted on July 17, 2017 by Mike Kushner in Blog, Local Market, Trends No Comments

Net absorption falls by 3.5 million square-feet with more space to come!

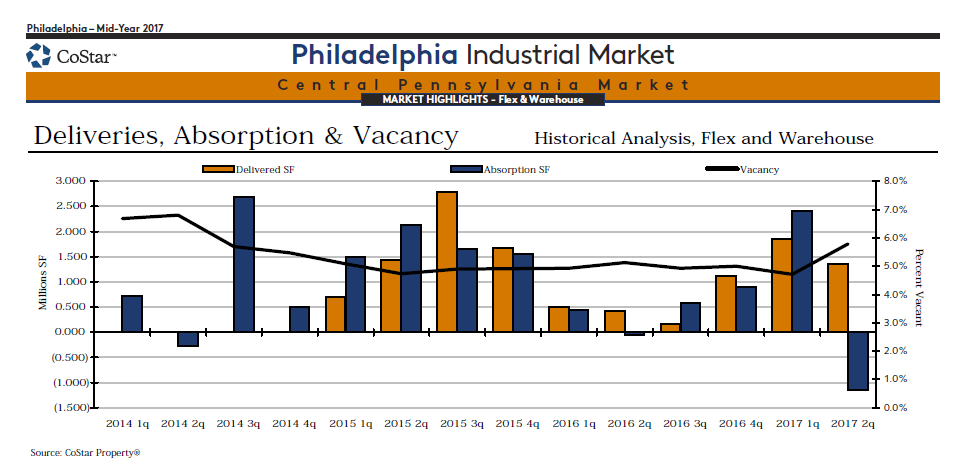
In the first quarter of 2017, the Central Pennsylvania industrial real estate market* gained more than two million square-feet of new space. Now into the second quarter, the rate at which we’re adding new space has slowed, but the market is still trying to absorb what was dumped into it earlier this year. As a result, net absorption fell into the negatives, decreasing by more than 3.5 million square-feet from last quarter. The vacancy rate also rose by more than a whole percentage point. Most interestingly, the quoted rental rate actually rose by a penny, placing it back near the recent record high we saw at the end of 2016.

How does this all tie together and what does it mean for the future of Central Pennsylvania’s industrial real estate market? Take a look!

SELECT YEAR-TO-DATE DELIVERIES

As far as new deliveries, Q2 slowed considerably from what we experienced in Q1. Within the first quarter of 2017, Central Pennsylvania received five new industrial properties, totaling a combined 2,244,371 square-feet of space. Now in the second quarter, just three new buildings were completed and added a total of 1349,697 square-feet to the market. Two of these buildings ranked among CoStar’s top 15 select-year-to-date deliveries. Goodman Logistics Center, Building 2 in Carlisle was completed this quarter, adding 938,828 square-feet of unleased space to the market. The other building, located at 53 Commerce Drive in Mechanicsburg, delivered 340,869 square-feet of space, which is 40% occupied.

SELECT TOP UNDER CONSTRUCTION PROPERTIES

Looking forward, Central Pennsylvania stands to gain a considerable amount of new industrial space in the coming year. Five properties are under construction and are set to be delivered later this year and into 2018. The largest is located at 100 Fry Drive in Mechanicsburg with 1.1 million square-feet of fully preleased space that will be completed next quarter. The second largest is Orchard Business Park II, Building A, in York with 780,000 square-feet of unleased space that will be completed in the fourth quarter of 2017. Additionally, the former Quaker Oats manufacturing and distribution facility, located at 485 St. Johns Church Road in Hampden Township, is being renovated into a smaller, modern warehouse facility. The renovation and expansion work will be done by April 2018, and the new warehouse section will be done by next July.

SELECT TOP SALES

Within the last two months, three buildings in Carlisle have sold, totaling an exchange of 2,222,121 square-feet of industrial space. The largest is the Ames True Temper Building with 1,226,525 square-feet which sold for $90,150,000 to Clarion Partners. Located at 1 Ames Drive in Carlisle is 595,000 square-feet of industrial space that sold to UPS for $55 million. Finally, at 100 Louis Parkway, 400,596 square-feet of space sold to Industrial Property Trust for $28,850,000.

ABSORPTION

Net absorption fell significantly this quarter, plummeting to a negative 1,1446,892 square-feet. This is a large drop from the positive net absorption of 2,402,682 square-feet we saw just last quarter. This is the lowest net absorption has been since prior to 2013. With five buildings delivered last quarter, three delivered this quarter, and five more under construction, the rise or fall of future net absorption will be mostly determined by the ability to lease out all of this new space.

VACANCY & RENTAL RATES

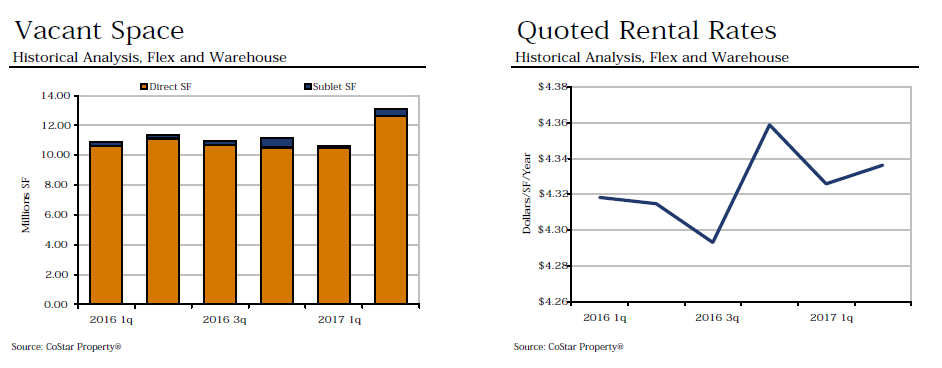
As you might expect, based upon other trends, Central Pennsylvania’s vacancy rate for industrial space rose from 4.7% last quarter to 5.8% this quarter. Vacant space also rose by more than 3 million square-feet. Even with negative net absorption and an increase in vacancy rate, the quoted rental rate rose ever so slightly. It is now $4.34, nearly back to the recent record high we experienced at the end of 2016 when it reached $4.36. It will be interesting to watch how the market reacts to the recent influx of new space, further impacting the vacancy and rental rates for Q3 and beyond.

What trend from the second quarter did you find most interesting or impactful to Central Pennsylvania industrial space? Share your insights by leaving a comment below.

*For the purposes of this article, the Central Pennsylvania market is defined as Dauphin, Cumberland, York, Lancaster and Adams Counties.

Learn more from past market reports:

Central Pennsylvania Industrial Real Estate Report for Q1 2017

Amidst Massive Retail Closings, Central PA Commercial Real Estate Continues to Grow

Central PA’s Office Real Estate Market Hangs on to Low Vacancy, Slows Down on Net Absorption

analysis, central pa, central pennsylvania, Commercial Real Estate, data, dillsburg, harrisburg, hershey, industrial, lancaster, lemoyne, market, mechanicsburg, Mike Kushner, new cumberland, news, pennsylvania, report, statistics, trends, warehouse, york

Influx of New Construction Impacts Central PA’s Industrial Real Estate Market

Posted on November 15, 2016 by Mike Kushner in Blog, Local Market, Trends No Comments

In the third quarter, we saw some interesting trends emerging in the local industrial real estate market that appear to be just the beginning of a bigger movement yet to come.

Five new buildings have already been delivered so far in 2016 and there are 11 more buildings under construction with a total RBA of 4,820,849 sqft of space. Furthermore, much of this space is currently unoccupied which will have a big impact on net absorption and vacancy rates, among other things.

Let’s take a look at the most important trends we saw take place in Q3 2016 in the Central Pennsylvania industrial real estate market followed by our analysis of the effect this will have on the market.

Select Year-to-Date Deliveries:

Five of the top 15 Select Year-to-Date Deliveries in the Greater Philadelphia market took place in Central PA. Of these five, two were delivered in Q1 and three were delivered in Q2. None were delivered in Q3. For a quick recap, here are the square footage and occupancy of the buildings that have been delivered in the Central PA market so far this year:

  • 139 Fredericksburg Road (Lebanon Valley Distribution Center), 874,126 sqft and 0% occupied
  • 545 Old Forge Road, 500,000 sqft and 0% occupied
  • 10874 2nd Amendment Drive (Susquehanna Logistics Center), 423,300 sqft and 100% occupied
  • 192 Kost Road, 422,400 sqft and 0% occupied
  • 501 Old Forge Road (LogistiCenter 78-81), 405,000 sqft and 100% occupied (in the Q4)

Top Under-Construction Properties:

A large construction project broke ground this quarter in Central PA. United Business Park, located off Interstate 81 in Southampton Township plans to add 1,491,600 sqft of industrial space to the market by Q2 2017. This is one of two distribution centers that combined will offer about 2.7 million sqft of space in Franklin County. New Jersey-based Matrix Development Group is among the most active industrial developers in Pennsylvania and New Jersey. Sheetz will be the first tenant in this space in this space and they hope to offer other large companies like Proctor and Gamble who want to efficiently reach the Northeast and Mid-Atlantic populations.

Select Top Sales

Four of the nine Select Top Sales in the Greater Philadelphia Market between July 2015 and September 2016 have taken place here in Central PA. Though none have taken place specifically in Q3, here is a quick recap of the building that have been sold during this time:

  • 1 True Temper Drive (Carlisle), 1,226,515 sqft for $90,150,000
  • 234 Walnut Bottom Road – Park 81 (Shippensburg), 1,495,720 sqft for $83,000,000
  • 100 Louis Parkway (Carlisle), 400,596 sqft for $28,850,000
  • 1225 S Market Street (Mechanicsburg), 596,703 sqft for $21,350,000

Absorption and Demand:

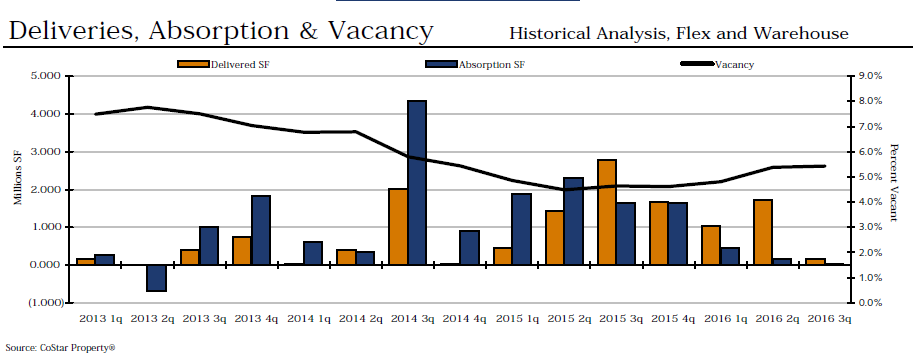
This quarter, net absorption fell drastically from 164,650 sqft (Q2) to 28,978 sqft. Though still in the black, this is the lowest number we’ve seen for net absorption since Q2 2013 when it dipped into the red at negative 683,020 sqft. Only one building was delivered this quarter with an RBA of 165,800 sqft which is currently not occupied. Additionally, 11 buildings are under construction with a total RBA of 4,820,849 sqft of new space coming to the market soon. From what we’ve seen in the Top Under-Construction properties in the Q3 CoStar report, many of these are 0% occupied at this time. Should more unoccupied space hit the market, we could expect to see net absorption decrease even further, possibly dipping into the red.

deliveries-absorption-and-demand

Vacancy & Rental Rate:

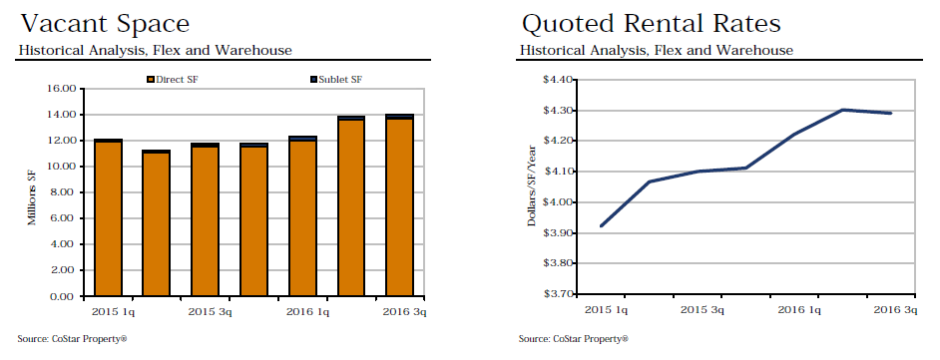
The vacancy rate remained the same this quarter at 5.4% after its big increase from Q1 to Q2 where it jumped 0.6% to the highest rate we’ve seen since Q4 2014. Given the projects under construction, we might expect this to increase further in the coming quarters as these properties are delivered. While vacancy stayed steady, the quoted rental rate decreased by 1 cent to $4.29 per square foot.

vacant-space-and-quoted-rental-rate

Our Summary:

Construction activity continues to be one of the prime drivers of the Central Pennsylvania industrial market. Speculative construction currently accounts for 70.5 percent of all construction projects.  New construction has created opportunities for tenants in a market that has otherwise been difficult to enter.  As developers noticed requirements are larger than quality options in the market, speculative projects broke ground to meet the needs of the active requirements.

Moving forward for the remainder of 2016, speculative construction will continue to exceed build-to-suit projects.  While demand continues to be strong, a large volume of construction has delivered vacant this year, likely causing market conditions to shift to tenant favorable by 2018 due to large increases in Class A inventory and pending economic slowdown.

Based upon the data for Central PA’s industrial real estate market in Q3 2016, what do you find to be most interesting or important? Share your insight by commenting below!

[Online Resources] Real Estate, analysis, blog, camp hill, carlisle, central pa, central pennsylvania, costar, cumberland, data, dauphin, facts, harrisburg, hershey, industrial, lancaster, lemoyne, mechanicsburg, Mike Kushner, new cumberland, news, numbers, Omni Realty, report, statistics, summary, trends, york
  • 1
  • 2
  • 3

Subscribe To Our Blog

  • This field is for validation purposes and should be left unchanged.

Mike J Kushner, CCIM

  • Contact me for a FREE Lease Review!
  • This field is for validation purposes and should be left unchanged.

Categories

  • About Us
  • Blog
  • CCIM
  • Commercial Real Estate
  • Community
  • Construction
  • CPBJ Articles
  • CREDC Articles
  • Feature
  • Featured Opportunities
  • Guest Blogger
  • Healthcare
  • In the News
  • Industrial
  • Local Market
  • Office Leasing
  • Retail
  • Success Stories
  • Tenant Representative/Buyer Agent
  • Trends

(c) 2019 OMNI REALTY GROUP- Website Design by The John Webster Company