OMNI Realty Group
  • Email
  • Facebook
  • Linkedin
  • Twitter
  • Rss
  • Home
  • Omni Advantage
    • Success Stories
    • Our Clients
    • Completed Deals
    • In the News
  • Services
  • Resources
    • Market Reports
    • Local Market
    • Office Space Calculator
    • CCIM Advantage
      • User Investment
      • CCIM Brochure
      • Total Expertise
      • Distinguish Yourself
      • How Would You Rate
  • Global Reach
  • Property Search
  • FAQ
  • Blog
  • Contact Us

Posts tagged "demand"

Home» Posts tagged "demand"

Cannabis-Friendly States Get Major Boost in Commercial Real Estate

Posted on February 25, 2020 by Mike Kushner in Blog, Commercial Real Estate, Local Market, Trends No Comments

Already there are 33 states and the District of Columbia that have legalized marijuana use in some form. Many of these states, like Pennsylvania, allow for limited medical use. According to a recent article, dispensaries in Pennsylvania have sold more than seven hundred million dollars of medical marijuana since the Commonwealth implemented the program, just under two years ago. In that time, nearly 150,000 Pennsylvanians are now certified to buy weed.

While the debate of whether to legalize marijuana – medicinal or recreational – is heated, there is one aspect of this topic that is clear. The demand for the production and sale of medical marijuana is evident, both locally and nationwide. And for cannabis-friendly states, the demand for commercial real estate is on the rise. What does this mean for commercial real estate here in PA? Let’s take a look at a few key points.

Increased Demand for Both Commercial and Residential

States where medical and recreational marijuana are legal have seen increased property demand in both the commercial and residential sectors, according to a new study by the National Association of Realtors. The study also revealed that more than a third of real estate professionals polled said they saw an increase in requests for warehouses and other properties used for storage. In the same states, up to a quarter of members said they saw a spike in demand for storefronts, and one-fifth said there was a greater demand for land. States where marijuana has been legal the longest have seen the largest impact on both commercial and residential real estate.

A Double Edge Sword for Residential Real Estate

However, the residential sector has not benefited as much as the commercial sector; in fact there have actually been a few drawbacks as buyers assess the “new normal” of living near a grow house or dispensary. While between 7% and 12% of those polled said that they had seen increases in property values near dispensaries, between 8% and 27% said they’d seen property values fall. Homeowners are still adjusting to how they feel about purchasing property near areas of marijuana growth and consumption. In states where recreational marijuana is legal, 58 to 67 percent of residential property managers have seen addendums added to leases which restrict smoking on properties. The most common issue was the smell, followed by moisture issues.

CRE Investors See This as a Big Opportunity

Cannabis investors are buying up commercial property, particularly warehouses, in states where recreational and/or medicinal cannabis use has been legalized for more than three years, which was revealed in the same NAR study referenced above. Investors realize it is important to understand the supply and demand, and the regulatory dynamic in each state. Focusing on states with higher barriers to entry makes a license more valuable and makes that real estate more valuable. In 2018, warehouse demand in states with only medical use outpaced demand in states with recreational use, 34% to 27%, respectively, according to the NAR study.

The Economic Impact in Pennsylvania

Sales and participation have ramped up significantly since the program’s inaugural year. Last February, total sales had amounted to just $132 million, per the PA Department of Health. Fast forward twelve months, and the tally has risen to $711 million. That puts the Commonwealth  at 439% sales jump from year one to year two. In a snap shot, Pennsylvania’s medical marijuana program has:

  • 287,000 people registered
  • 261,000 patients
  • 1,800 registered doctors
  • 1,300 approved doctors (practitioners)
  • 168,000 active patients (2-2.5 visits a month)
  • 4 million patient visits
  • $711 million in total sales
  • $288 million wholesale
  • $423 million in retail sales
  • $110 avg. purchase per visit
  • 22 of 25 GPs are approved
  • 15 of 25 GPs are shipping product
  • 77 dispensaries are operational

Furthermore, dispensary operators don’t seem to think we’ve reached the saturation point yet. As more licenses are made available, and whatever lie ahead for further legalization of marijuana, one things is certain. As demand increases for marijuana, so will the demand increase for commercial estate.

What’s next for marijuana in Pennsylvania?

Back in October 2019, Governor Tom Wolf came out in favor of legalizing cannabis for recreational use. Last spring, a Franklin & Marshall College Poll showed that 59 percent, or nearly seven in 10 voters, support the idea of legalizing marijuana. But voter support alone is not enough. The legislation will have to pass both the House and the Senate, with much opposition particularly from the Republican Party.

While this doesn’t mean the possibility of someday legalizing recreational marijuana in Pennsylvania is off the table, it does mean there will be many hoops to jump through – just as there was for the legalization of medicinal use. Looking at the issue solely from an economic standpoint, there is much to be gained by continuing to open this market and remove barriers; however there are many other issues to consider.

Given the boost this has brought to commercial real estate, with the demand for more industrial and retail space, combined with more interest from CRE and cannabis investors, it’s wise to continue to watch for trends – both negative and positive. Looking to other states as examples also gives us insight into what to expect as the cannabis market in Pennsylvania grows, and how CRE professionals can continue to capitalize on the opportunity.

Do you agree with these trends and insights? Or do you have another viewpoint to share? Join in the conversation by leaving a comment below.

[Online Resources] Real Estate, blog, buyers agent, camp hill, cannabis, carlisle, central pennsylvania, Commercial Real Estate, commercial real estate agent, commercial real estate broker, CRE, demand, Economy, growth, harrisburg, industrial, lancaster, lebanon, legalization, lemoyne, marijuana, mechanicsburg, medical marijuana, Mike Kushner, new cumberland, office, Omni Realty Group, pennsylvania, retail, space, tenant representative, trends, york

Growing U.S. Economy Drives Demand for Commercial Real Estate

Posted on February 13, 2020 by Mike Kushner in Blog, Commercial Real Estate, Trends No Comments

The current economic climate in the United States has been a bit of a roller coaster, and depending upon the industry you’re examining, you may find more ups than downs or vice versa. Trade wars, combined with a slowdown in the U.S. manufacturing sector and around the globe, shook up equity markets and businesses in 2019. But robust job growth has extended the spending power of American consumers, which is ultimately our nation’s economic engine, according to CoStar’s 2019 Year in Review of the U.S. Economy.

To put this into perspective, the United. States is currently experiencing the longest economic expansion since World War II. Additionally, key indicators point to the economy staying solid in 2020, which will extend the record bull run for U.S. commercial real estate. While there are some risks that could eventually move the nation toward a recession, as it stands, the growing U.S. economy is driving demand for commercial real estate, with many factors emerging as a result. Let’s take a look at what the most profound outcomes of this CRE growth.

The growing economy bodes well for demand for commercial and multifamily real estate.

What it means for CRE: Expanding payrolls will continue to fuel demand for office space, while rising incomes and consumption will boost demand in industrial and retail sectors. As job growth continues, consumers appear quite optimistic and unconcerned by the trade war and any economic slowdown abroad.

Migration of workers from the Northeast and Midwest is growing the labor markets, which is fueling real estate demand, specifically in the South and U.S. West.

What it means for CRE: With the increase in labor as well as a growing demand for real estate in the South and U.S. West regions, CRE developers and investors should look to these markets as viable areas of growth. An increase in job creation also means a rising demand for office spaces and apartments. Property management will benefit from high occupancy rates, and job growth will lead to an increase in leasing. With low interest rates, commercial prices will likely see some gains.

The answer to combat rising development costs and rental prices in urban areas may be micro-apartments.

What it means for CRE: Simply put, micro-apartments extract the most value from every square foot. Standardized designs and “pre-fab” or modular construction cut development costs and shorten construction time, meaning developers could reduce expenses and start generating rental income more quickly. Some developers are designing studio apartments that are one-fifth the size and 40% of the cost of a typical studio, netting out to as little as 175 square feet.

Investing in industrial real estate, over retail, is the safer bet.

What it means for CRE: The industrial vacancy rate is extremely low, in many cities it’s below 5%, even 1% to 2% in some areas. Meanwhile, internet sales are cannibalizing traditional retail spaces, such as department stores, malls, and shopping centers. A unique aspect of this changing market is the emergence of “click-to-brick” retailers, like Amazon, that are establishing small retail stores in key areas. These spaces don’t carry much inventory, but they give customers the opportunity to interact with physical products and place an order. So for CRE investors and developers, industrial real estate carries more certainty and less risk than retail at this time.

Moving into the new decade, economists expect economic growth to slow somewhat as the labor market cools.

What it means for CRE: Consumer spending may lose some momentum and persistent global and trade policy headwinds weigh on business sentiment and investment. For commercial real estate, 2020 should remain a solid year of growth, especially for the industrial market. Though real estate professionals should remain strategic and always be looking ahead to factors that could impact economic growth, and CRE growth as a result.

What is your view of the current state of the nation’s economy right now? How do you anticipate this changing in 2020? Share your thoughts and insights by leaving a comment below.

[Online Resources] Real Estate, buyers agent, central pennsylvania, Commercial Real Estate, Construction, demand, economic impact, Economy, growth, industrial, jobs, Mike Kushner, office, Omni Realty Group, pennsylvania, retail, tenant adviser, trends, united states

Real Estate Trends to Impact the United States in 2018

Posted on December 27, 2017 by Mike Kushner in Blog, CPBJ Articles, Trends No Comments

Note: This article was published by the Central Penn Business Journal. Click here to read the original version.


Rapid technological advancements and significant demographic shifts significantly influence the real estate industry. These various factors like growing urbanization, longevity of Baby Boomers and differentiated lifestyle patterns of Millennials are changing the way people value real estate. Add into the mix macroeconomic and regulatory developments, and you have the perfect storm for some significant changes to come to the real estate market in 2018.

With the many changes that have already taken place in 2017, many real estate companies find themselves searching for ways in which they can gain a competitive advantage and drive top- and bottom-line growth in the New Year.

To achieve this, we must identify and monitor emerging trends that are likely to impact the economy moving into 2018. Take a look at the top trends that are shaping the U.S. real estate industry right now!

ECONOMIC OUTLOOK: Increasing interest rates could temper growth

  • Federal Reserve is likely to raise interest rates in the short-to-medium term. Volatile global markets have led to continued low interest rates, but that’s expected to come to an end in 2018. Higher interest rates are likely to increase mortgage costs and could deter real estate investments to some extent.
  • Gross domestic product growth will likely increase 2.5 percent in 2018. It’s the same as in 2017, but better than the 2.1% growth in 2016. The modest economic improvement could temper the pace of commercial real estate (CRE) transaction activity.
  • Improving labor markets and household wealth will boost consumer confidence. The U-5 unemployment rate which includes discouraged workers and all other marginally attached is expected to drop under 5 percent. The employment-to-population ratio is projected to peak in 2018, as retiring Baby Boomers may reduce the share of employed.

REGULATORY OUTLOOK: Greater compliance means greater cost

  • Increased compliance and administration costs will result from the new accounting standards on lease accounting and revenue recognition that will primarily impact real estate investment trusts (REITs) and engineering and construction (E&C) companies.
  • Risk retention rules will lower issuance of commercial mortgage-backed securities (CMBS). We are also likely to see a reduction in capital availability in secondary and tertiary markets.
  • The Protecting Americans from Tax Hikes (PATH) Act of 2015 will ease REIT tax provisions and R&D tax credits for E&C companies, while increasing the flexibility to invest in startups for R&D experimentation. However, corporate tax reforms will reduce flexibility for corporations to spin off real estate assets into REIT structures.

DISRUPTIVE TRENDS: These factors are reshaping the face of CRE

  • Collaboration and Sharing.These sound like two positive trends, right? They certainly are for startups who utilize new platforms and business models like Airbnb or WeWork to reduce their real estate overhead. However, this type of collaboration and sharing of space is disrupting the way organizations lease and use commercial real estate space for their businesses. Traditional CRE companies will need to rethink their approach toward space design, lease administration, and lease duration in order to compete.
  • CRE data is becoming more ubiquitous and transparent thanks to technological advancements. The traditional brokerage model is being threatened by the increasing ease and efficiency of online leasing. Traditional brokers will need to diversify their services to include consulting and collaboration.
  • A growing demand for mixed-use developments as consumers prefer to “live, work and play” in proximity. This demand is the result of a shortage of workers with strong STEM skills, rising urbanization and Millennials’ preference for an open and flexible work culture. Companies trying to compete for this type of talent should choose office locations in areas that cater to the living and working environments preferred by their ideal candidates.
  • Rising demand for fast and convenient online retailing is disrupting the retail and industrial markets. Innovations in speed and mode of delivery (such as same-day delivery and e-lockers) will decrease the demand for large retail and industrial spaces. This trend will also cause a blurring of the lines between these two properties. For example, some retail space could double as fulfillment centers. To stay afloat, retailers will need to try different store formats to appeal to the consumer, while industrial properties should focus on smaller, more flexible spaces located near cities.
  • A change in how we get around will also change how we use real estate. With each passing year, more and more people rely upon “pay-per-use” vehicles and rideshare platforms like Zipcar, Uber and Lyft. We also get closer to self-driving vehicles. This major disruption to the entire mobility ecosystem will result in fewer people owning and driving their own vehicles, especially in urban areas. This will free up large parking spaces in prime locations that can be put to different uses. Real estate companies should begin to explore ways to reduce and repurpose parking space as a means to generate more income.

Over the course of the next 12 months, the U.S. commercial and residential real estate industry can expect to be hit with various changes and challenges. Some of these changes may have a favorable impact, while others could impose some serious setbacks. For real estate businesses to gain a competitive advantage and drive top- and bottom-line growth in 2018, they should take note of these emerging trends and work on developing a strategy now to react to the changing market, when the time comes.

What real estate trend do you think will have the most significant impact on the United States in 2018? Share your insights by leaving a comment below!

[Online Resources] Real Estate, 2017, 2018, buyers agent, central pennsylvania, commercial, demand, Economy, growth, industry, Mike Kushner, Omni Realty, prediction, regulation, residential, tenant representative, trends, united states

Central Pennsylvania Industrial Real Estate Report for Q1 2017

Posted on April 20, 2017 by Mike Kushner in Blog, Commercial Real Estate, Local Market, Trends No Comments

Region gains more than two million square feet of new industrial space in first quarter

2017 is on track to becoming one of the best years yet for industrial real estate in Central Pennsylvania – and we’ve only just wrapped up the first quarter! The market absorbed more than 2 million square feet of new space, while increasing net absorption and holding on to the highest rental rate per square foot that we’ve had in over four years. The vacancy rate also holds steady at 5.5%, even with an increase in vacant space.

The market almost can’t get its hands on space fast enough. Five of the six buildings delivered this quarter made it to CoStar’s Top 10 list. Additionally, nine new buildings are under construction and will deliver yet another 4,410,916 square feet of new space.

To see the full impact of the growth taking place in Central Pennsylvania’s industrial real estate market, take a look at the highlights from Q1 2017.

SELECT YEAR-TO-DATE DELIVERIES

Within the first quarter of 2017, Central Pennsylvania received six new industrial properties, totaling a combined 2,244,371 square feet of space. Five of these made it to CoStar’s list of Select Year-to-Date Deliveries. The first and largest is the Eden Road Logistics Center in York with 754,881 square feet of space. Next, Carlisle Distribution Center – Building 5 delivered 582,000 square feet of space. The Crossroads Logistics Center in Jonestown delivered 398,250 square feet of space. The property at 51 Commerce Drive – Building 1 in Reading delivered 339,200 square feet of space. And the property at 1451 Stoneridge Drive in Middletown contributed an additional 10,200 square feet of space.

SELECT TOP UNDER CONSTRUCTION PROPERTIES

If six new properties delivering in the Q1 wasn’t enough to prove the rapid growth of industrial real estate in Central Pennsylvania, there are yet nine more properties under construction, four of which made it to CoStar’s list of Select Top Under Construction Properties. A 1.1 million square-foot property located at 100 Fry Drive, Mechanicsburg is expected to deliver in Q3. A 1,002,000 square-foot property located at 575 Old Forge Road, Jonestown is also expected to deliver in Q3. The Goodman Logistic Center Carlisle – Building 2 will deliver 938,828 square feet of space in Q2. Finally, Orchard Business Park II – Building A will deliver 780,000 square feet of space in Q4.

SELECT TOP SALES

Among the year’s select top sales, are three worth noting that took place in Central Pennsylvania. The Ames True Temper building in Carlisle (1,226,525 square feet) sold for $90,150,000 to Clarion Partners. Target Distribution Center in York (785,400 square feet) sold for $60,000,000 to AEW Capital Management. And the building at 100 Louis Parkway in Carlisle (400,596 square feet) sold for $28,850,000 to Industrial Property Trust.

ABSORPTION

2017 is setting records all around for industrial real estate in Central Pennsylvania. Q1 boasts the largest number of buildings in existing inventory (3,635) and the largest total RBA (262,658,186 square feet) we have ever seen. In less than four years, the local market gained 45 new buildings, with nine more under construction. Even with all of this new inventory entering the market, net absorption continues to increase, proving the demand for more space. Net absorption this quarter rose from 992,800 square feet to 2,107,328 square feet. This is the highest net absorption we’ve seen since Q2 2015 and the third highest since it plummeted into the negatives in Q2 2013.

VACANCY & RENTAL RATES

Total vacant space increased from 14,255,260 square feet to 14,392,303 square feet this quarter. Even with this increase, the vacancy rate holds steady at 5.5%, where it’s been since Q2 2016. The quoted rental rate also remains steady at $4.36. This is the highest price per square foot we’ve seen prior to Q2 2013, again proving a healthy demand for industrial real estate in Central Pennsylvania!

What trend from the first quarter did you find most interesting or impactful to Central Pennsylvania industrial space? Share your insights by leaving a comment below.

Learn more from past market reports:

Central Pennsylvania CRE Market Reports Q4 2016

Predictions for Trends and Changes in Commercial Real Estate in 2017

Influx of New Construction Impacts Central PA’s Industrial Real Estate Market

[Online Resources] Real Estate, central pennsylvania, Commercial Real Estate, Construction, costar, CRE, demand, expert, facts, first quarter, industrial, market report, Mike Kushner, more space, new space, Omni Realty Group, pennsylvania, space, statistics, supply, trends, vacancy

Predictions for Trends and Changes in Commercial Real Estate in 2017

Posted on February 6, 2017 by Mike Kushner in Blog, Commercial Real Estate, Trends No Comments

2017 trends concept - handwriting on a napkin with a cup of espresso coffee

It’s the start of a new year and naturally this turns our attention toward what we predict will happen in the coming 12 months. Specifically in the commercial real estate market, there are several noteworthy trends and changes we predict to take place in 2017. What are these and how will they impact the various sectors of commercial real estate? Here’s the breakdown!

Office Real Estate

Experts are predicting that suburban markets will outperform downtown markets in 2017. Suburban rent growth is anticipated to exceed 2% while vacancies will only increase 10 base points (to 14.5%). In contrast, downtown vacancies are expected to increase by 30 base points (to 10.9%). The explanation to this growth is that suburban development is catering to millennials who want to live, work and socialize all in the same area. While national occupancy in downtown office space will still far exceed the suburban markets, suburban office space will have a much higher growth rate in 2017, relatively speaking.

Industrial Real Estate

Out of all of the sectors, industrial real estate will have the best year in 2017. Major growth in e-commerce as well as technological advancements, like driverless vehicles, have been fueling this sector’s growth. As these industries continue to thrive, so will industrial real estate! Availability sits at a 15-year low while net occupancy achieved its 26th quarter of record gains (as of Q3). Best of all, rents continue to climb toward a record-setting high. Because it wouldn’t be fair not to throw in a little bad news to keep things balanced, the sector is expected to slow down a bit as the result of a wane in user demand.

Retail Real Estate

2016 was not a good year for retail and it looks like 2017 will continue to get worse. Brick-and-mortar stores are closing and consolidating while e-commerce proves to be the way of the future. Online sales are expected to increase by 15.5% (to 9.2%) this year. On a brighter note, Class A malls are expected to maintain or increase their rents per square foot, as they have for the past five years. Also, experts predict that mixed-use lifestyle developments will be a possible solution for brick-and-mortar locations to compete with e-commerce. Finally, community strip centers are expected to grow by 1.7% in 2017.

Hotel Real Estate

In 2017 we expect to see a healthy labor market and wage growth which will ultimately benefit hotel real estate through an increase in leisure and business travel. However, major competitors to the hotel market, such as Airbnb and similar home-sharing businesses will continue to thrive. This is expected to steal sales from hotels as the concept of home-sharing becomes more mainstream and robust.

Multifamily Real Estate

Overall, experts are optimistic for the multifamily real estate market in 2017, but that’s not without a few key challenges. An increase in supply this year will drive up vacancy rates and impact rental rates as a result. Interestingly, it’s the high-end apartments that will experience the most shrinking rents, while Class B and Class C apartments will be less impacted. This is the first time since the Great Recession that supply outpaced demand, as it did in 2016. It’s expected to continue into 2017 which leaves some major hurdles to face moving forward.

What sector of commercial real estate do you think will be the most changed in 2017? Share your insights by leaving a comment!

2017, business, decrease, demand, growth, hotel, increase, industrial, investment, investor, local, Mike Kushner, millennials, multifamily, national, news, office, Omni Realty, predictions, retail, supply, trends, young professionals

Central PA’s Office Market Sets Recent Records for Vacancy, RBA and Rental Rates!

Posted on October 19, 2016 by Mike Kushner in Blog, Local Market, Trends No Comments

At first glance, it didn’t appear like Q3 2016 held any exciting news for Central Pennsylvania’s office real estate market. No top sales, no major projects delivered and only a couple projects under construction. But as we dug a little deeper into the numbers, we found that this quarter claimed recent record highs for RBA and quoted rental rates, as well as a record low for vacancy rate.

Together, these trends tell us that good things are happening within the local office real estate market, with numbers that continue to indicate growing demand. Let’s take a closer look at the highlights from Q3 2016 which we can use to analyze the current market and predict future trends.

Select Year-to-Date Deliveries:

CoStar’s list of Select Year-to-Date Deliveries includes two properties in Central Pennsylvania. Though none of these were delivered in Q3, it’s worth recapping that activity that has taken place so far in 2016. The Sterling Place Corporate Center in Mechanicsburg was delivered in Q2 with 129,000 square-feet of fully leased space. At 440 Walker Road, Chambersburg, 9,199 square-feet of space was delivered in Q1. Only 63% was preleased.

Top Under-Construction Properties:

Although no new properties were delivered in Q3, we expect to see at least one new office building delivered to the Central PA market in Q4. This property, located on Hogestown Road in Mechanicsburg, will add 129,000 square-feet of office space. It is 100% preleased.

Absorption and Demand:

Net absorption dropped this quarter by 70,917 square-feet. There has been a lot of fluctuation in net absorption from quarter to quarter and this continues in line with the trend. Total RBA did not budge from last quarter which was 54,902,624 square-feet. This maintains the recent record high that we reached in Q2, the highest RBA in Central PA since prior to Q4 2012.

deliveries-absorption-and-vacancy-q3-office

Vacancy & Rental Rate:

Vacancy decreased again this quarter to a recent record low of 6.0%. This is the lowest vacancy rate we have experienced since prior to Q4 2012. As might be expected with a decrease in vacancy, we also experienced an increase in the quoted rental rate. Now at $17.30 per square-foot, this is $0.04 higher than last quarter and only $0.03 less than the recent record high of $17.33 we saw in Q1 2016.

vacant-space-and-quoted-rental-rate-q3-office

Our Summary/Analysis:

All in all, Q3 brought positive news for Central Pennsylvania’s office real estate market. An increase in demand for space is driving down vacancy and driving up the price per square foot. New properties are at least 50%, if not 100%, preleased before they even hit the market. With another 100% preleased property expected to be delivered next quarter, we predict that 2016 will have a strong finish, indicating a healthy and growing office market.

Based upon the data for Q3 2016, what do you find to be most interesting or important? Share your insight by commenting below!

[Online Resources] Real Estate, analysis, business, buy, camp hill, central pa, Commercial Real Estate, Construction, cumberland, dauphin, demand, Economy, harrisburg, hershey, lancaster, lease, local, market, mechanicsburg, Mike Kushner, net absorption, new, office, Omni Realty, pennsylvania, property, rent, report, sales, space, trends, york

Central PA Welcomes More Office Space, Rising Rental Rates

Posted on April 11, 2016 by Mike Kushner in Blog, Local Market, Trends No Comments

Overall, 2015 has proven to be an active and eventful year for Central PA office real estate. Six new buildings were delivered into the market with four more under construction. The vacancy rate rose slightly, but remains lower than it has been in recent years. Additionally, net absorption dropped by nearly 175,000 square-feet, though it still remains in the black.

How has this activity impacted the market? And how do we anticipate it will reflect on the local economy? Let’s first take a look at the numbers to help guide our predictions for the market’s performance in 2016 and beyond.

Select Year-to-Date Deliveries:

Six of the top 15 Select Year-to-Date Deliveries are within the Central PA submarket. Looking at just those that were delivered specifically in fourth quarter 2015, there are two worth noting. Coming in at number three on the CoStar list is the office building at 1250 Camp Hill Bypass. This building has an RBA of 82,000 square-feet and is 100% occupied. It broke ground in fourth quarter 2014 and was delivered one year later. Next is the Cornwall Health Center coming in at number five on the list. Located at 1701 Cornwall Road in Lebanon, this building has an RBA of 54,234 square-feet and is 100% occupied. This multi-million dollar project is estimated to bring a burst of new jobs to the area.

Vacancy:

This quarter, we saw the vacancy rate rise ever so slightly from 7.5% to 7.7%. This returns the market closer to where it began the year, but is still lower than where we were one year ago at this time when the vacancy rate was 8.0%. Still, the overall trend is a decrease in vacancy rates. Comparatively to 2013 and prior, the vacancy rates were consistently at 8.0% or greater.

Absorption and Demand:

Net absorption took a major hit this quarter, dropping from 189,032 square-feet in Q3 to 15,921 square-feet in Q4. This is the lowest the absorption rate has been since one year ago at this time when it was negative 90,015. Overall, absorption rates in the Central PA office submarket have been volatile and hard to predict, often increasing or decreasing by more than 100,000 square-feet each quarter and dipping into the red a total of five times since Q1 2013.

Image from CoStar

Image from CoStar

Rental Rates:

The quoted rental rates increased ever so slightly this quarter by $0.07 to $17.22. This continues a steady climb in rates that began at the start of 2013. Since that time, they have increased by a total of $1.11. This is also the highest rental rate we have seen in the Central PA submarket since prior to Q1 2012.

Image from CoStar

Image from CoStar

Our Summary/Analysis:

Looking to the future, we can expect even more square footage to be added to the local market in 2016 as four buildings, currently under construction, will be delivered between the first and third quarters. Combined, these new buildings will contribute 277,590 square-feet of office space. This will have an impact on nearly all aspects of the market including net absorption, existing inventory, delivered inventory and vacant square-footage.

As for the health and strength of the Central PA submarket, the seemingly ever-increasing rental rate is a sign that businesses are demanding more space and willing to pay for it. And with the majority of year-to-date deliveries and under-construction projects nearly fully occupied, new office space continues to be in-demand.

What fourth quarter 2015 market trend do you find most interesting or impactful? Share your insights by commenting below!

[Online Resources] Real Estate, 2015, 2016, absorption, analysis, blog, business, camp hill, central pa, costar, demand, development, Economy, facts, fourth quarter, growth, harrisburg, health, hershey, lancaster, lemoyne, market, mechanicsburg, Mike Kushner, new cumberland, numbers, office, Omni Realty, opinion, pennsylvania, rent, rental rate, report, statistics, trends, vacancy, york

Manufacturing Continues to Grow in Central Pennsylvania: What’s Going On and Why It Matters

Posted on October 27, 2015 by Mike Kushner in Blog, CREDC Articles, Local Market, Trends No Comments

This article has been featured by the Capital Region Economic Development Corporation (CREDC) and can be also viewed on their website. 


Manufacturing Continues to Grow in Central Pennsylvania
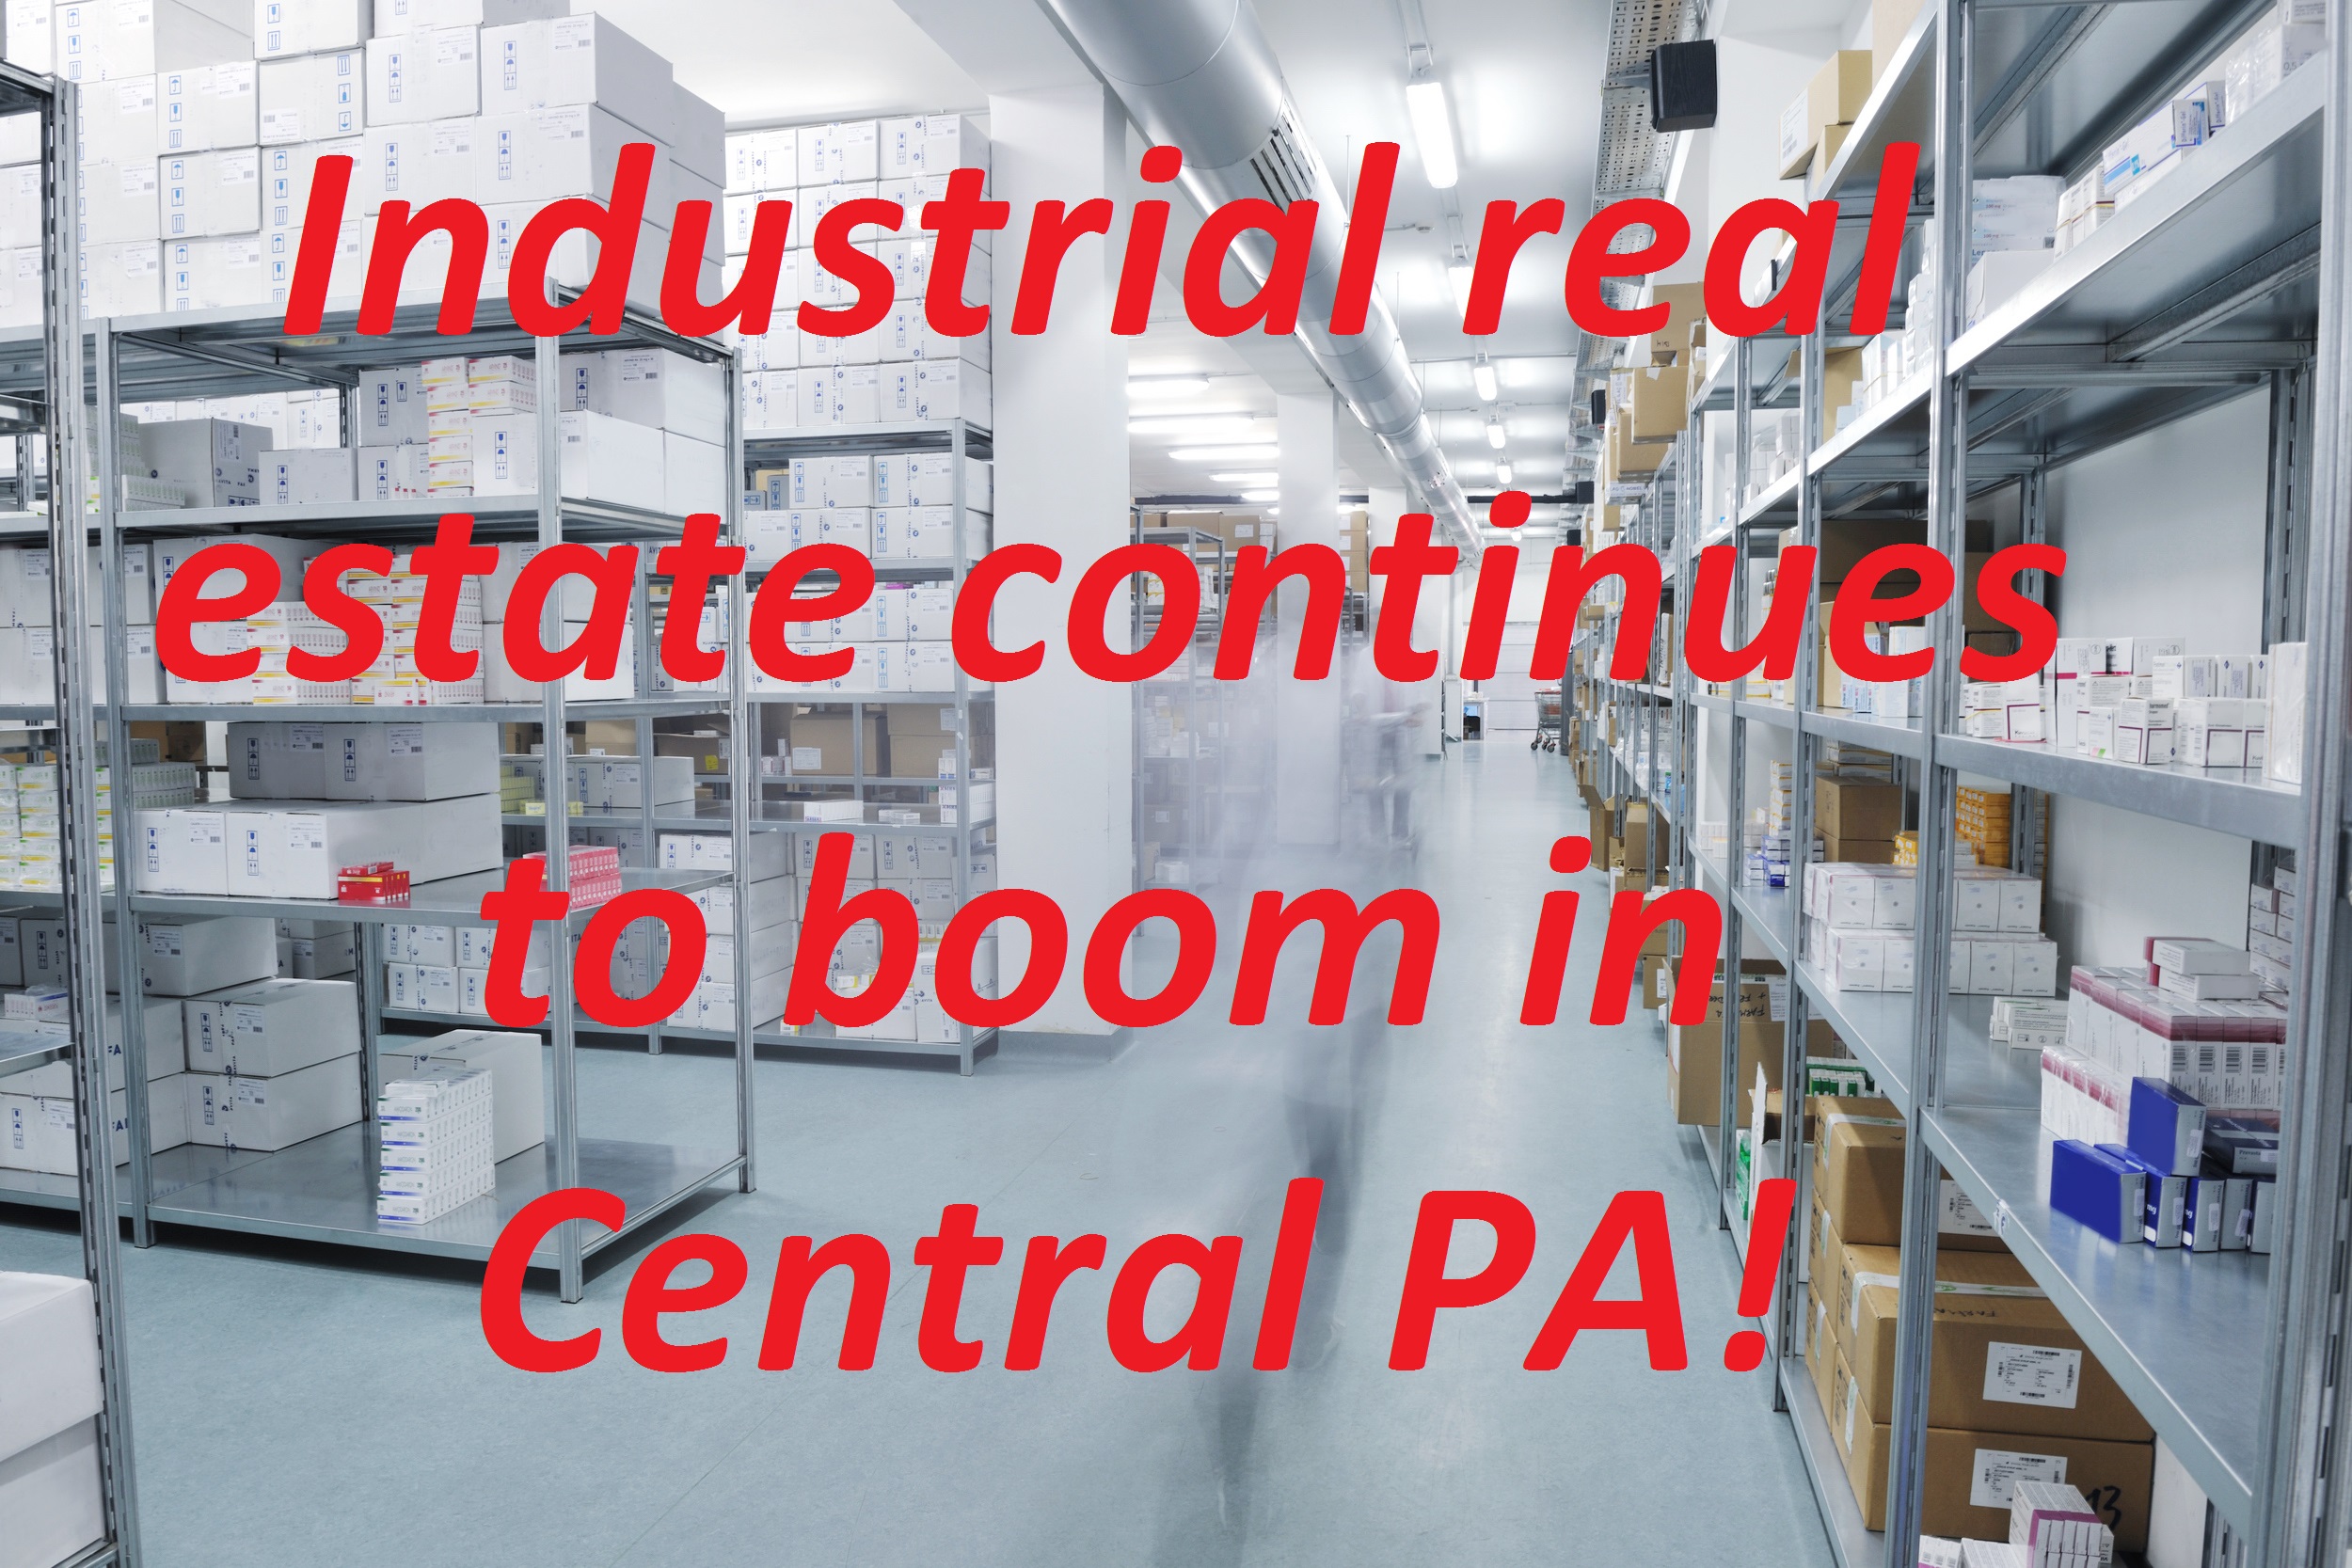
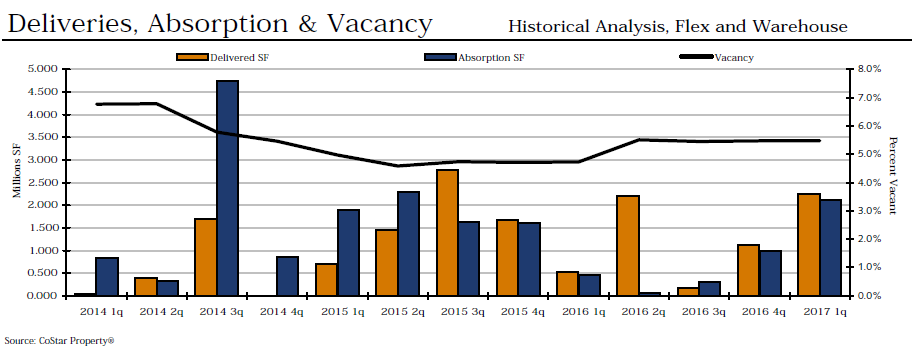
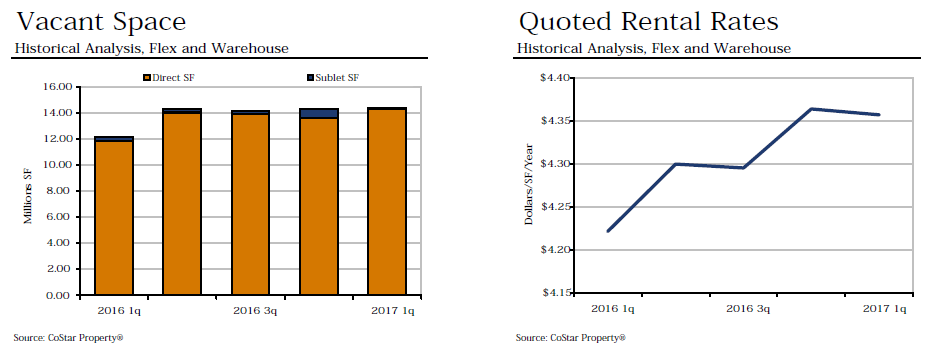
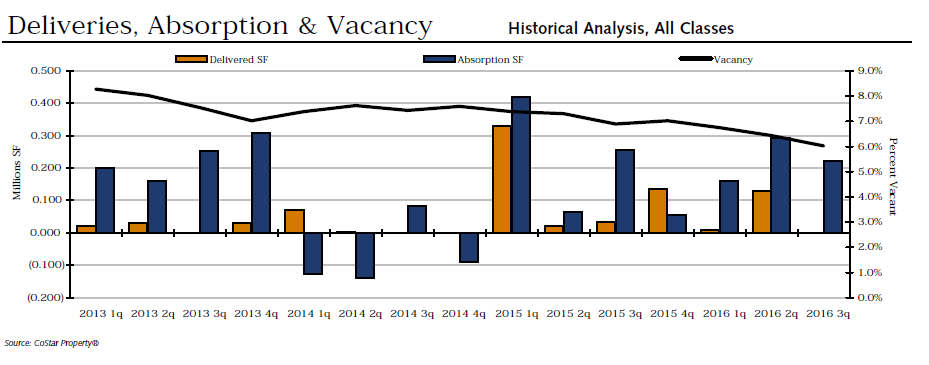
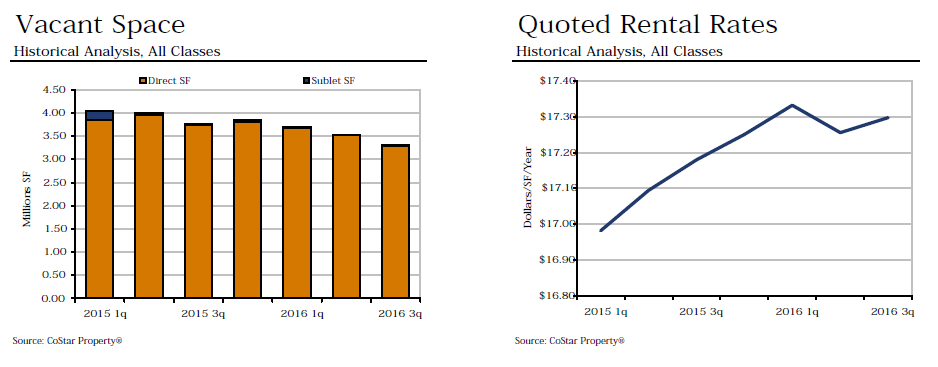
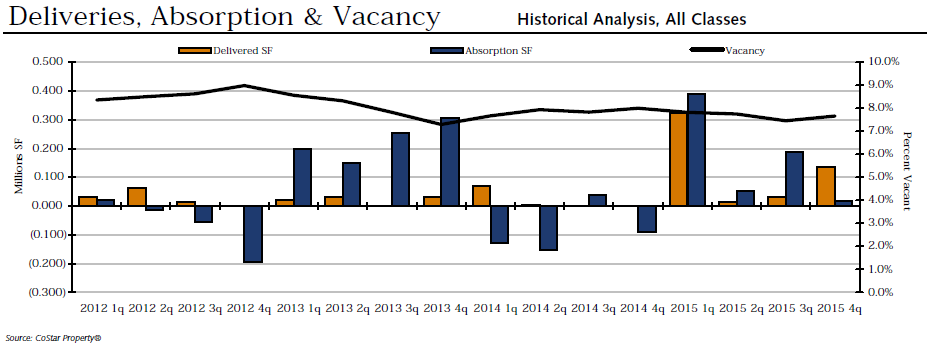
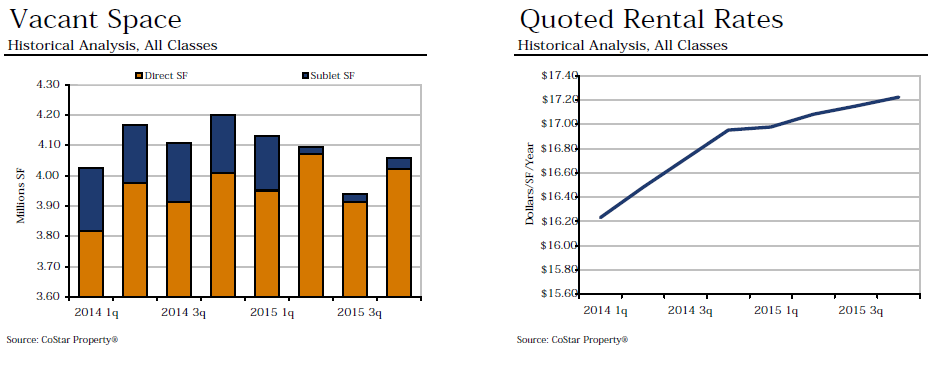
According to the PA Manufacturers Association, manufacturing and its affiliated businesses contribute $11 Billion to the economy in south-central Pennsylvania alone, providing our community with an estimated 110,000 jobs. This industry is a huge part of our local economy and its growth impacts the growth of many other businesses.

It should come as good news that the demand for manufacturing space is on the rise. Central PA is considered one of the premier “Big Box” industrial and multi-tenant logistics markets because of the area’s affordable cost of living, raw land and non-union labor. Additionally, the governmental approvals required for warehousing and distribution are comparatively easy and straightforward compared to other states or regions

As for location, this area is a central hub where products, after being manufactured, can be easily distributed throughout the northeast United States (via I-81, I-83, and I-78). Central PA also offers easy access to Port of Baltimore, MD and Port of Elizabeth, NJ and is within a one-day drive to 40% of the nation’s population.

For businesses who need to manufacture and distribute their goods far and wide, Central Pennsylvania is an obvious choice for setting up shop. No matter your particular business or industry, this growth matters to you too! It’s important to understand these trends and the various ways they will likely impact your business. Let’s take a look.

Current Market Trends Worth Noting:

Six more manufacturing buildings entered the market in the last quarter alone, giving us the highest RBA we have seen in more than two years at 62,988,707 square feet. Among this space, 60,527,229 square feet are currently occupied which showcases the high demand for manufacturing space in Central Pennsylvania.

Net absorption has also shown tremendous improvement since the 2013. Just two short years ago, net absorption was in the red by hundreds of thousands of square feet. The lowest point occurred in 2013 Q2 when net absorption was negative 403,861 square feet. The very next quarter, net absorption shot up to a positive 598,898 square feet. Though there has been some fluctuation in the market since, we have remained mostly in the black and currently have a net absorption of 30,468 square feet.

Additionally, Central Pennsylvania’s vacancy rate for manufacturing space has shown significant improvement from the 5.6% we saw in 2013 Q3. A steady decrease has brought this rate down nearly two whole percentage points to the 3.9% we see today.

Finally, the average rental rate has declined approximately $.20/SF since 2013, but has stabilized at approximately $3.50/SF in 2014 and 2015.

What this means to the Central Pennsylvania region:

To the many businesses that are directly and indirectly impacted by the manufacturing industry, the current real estate market is a positive indicator that other markets will follow this favorable trend. Growing manufacturing companies produce more jobs which spur growth in almost every other aspect of the economy from office and residential space to restaurants and shopping centers.

To the 110,000+ people who are employed by the Central Pennsylvania manufacturing industry, the market shows positive signs that these businesses continue to grow and also offers the potential of even more manufacturing businesses being drawn to the area.

Overall, Central Pennsylvania maintains its reputation for being a hub for manufacturing and distribution. The industrial real estate market, specifically for manufacturing space, reflects the strong and steady growth would we expect to see in this region.

View the original article on the CREDC website here. 

[Online Resources] Real Estate, blog, camp hill, Capital Region Economic Development Corporation, central pennsylvania, commercial, CREDC, cumberland, dauphin, demand, Economy, growth, harrisburg, industrial, industry, lancaster, local, manufacturing, market, mechanicsburg, Mike Kushner, Omni Realty, pa, region, trends, writing, york

Q2 Shows Why Central PA’s Industrial Real Estate is a Premiere ‘Big Box’ Market

Posted on August 18, 2015 by Mike Kushner in Blog, Local Market, Trends No Comments

To the hundreds of thousands of people who call Central Pennsylvania home, we have found countless reasons to fall in love with the area from our beautiful blend of distinct cultures to the Capital city and Hershey’s Chocolate World.

But to industrial businesses that rely upon the ease and affordability of shipping their products to make a living, Central Pennsylvania has an entirely unique list of reasons why planting roots in this area makes sense.

Looking at how our industrial real estate market performed in Q2 2015 provides us with some clear insights into why Central PA is such an attractive location for “Big Box” warehouse and multi-tenant logistics users around the world – and growing! Let’s take a look at what the numbers tell us.

Select Top Under-Construction Properties

Four of the top five Select Under-Construction Properties this quarter are located in the Central PA submarket. Combined, ProLogis Shippensburg, Nordstrom Distribution Center, ProLogis Carlisle – Building 1 and LogistiCenter Carlisle – Building 2 total more than 4 million square feet of new industrial space that will be delivered to the market between next quarter and Q2 2016. These high profile projects are an exciting sign of a growing and thriving industrial market here in Central PA.

Select Year-to-Date Deliveries:

Year-to-date, the Central Pennsylvania submarket has delivered over 1.7 million square feet of new industrial space. The property delivered specifically this quarter is located at 561 S. Muddy Creek Road in East Cocalico Township, Lancaster. This is the new location of Pet Food Experts’ $12 million, 197,000 square foot facility that is 100% occupied.

Vacancy:

In Q2, we experienced a substantial decrease in vacancy that resulted in a vacancy rate of 4.7%. Having fallen from 5.2% last quarter, this dip is the first we have been below 5% since 2008. In fact, back through 2011 we have most commonly seen vacancy rates in the high 7% and low 8%. This trend is sure to have impact in other areas of the market as well.

Absorption and Demand:

The net absorption decreased from last quarter’s 2,908,709 square feet to 1,423,990 square feet this quarter. Given last quarter delivered three new buildings and this quarter delivered just one, this is an appropriate net absorption for the quarter that does not signal a red flag

Deliveries Absorption and Vacancy Q2 Industrial

Rental Rates:

For the first time since Q4 2009, the quoted rental rate has exceeded $4.00 a square-foot, coming in at $4.07 for Q2 2015. This $0.13 increase to last quarter’s quoted rental rate of $3.94 is certainly connected to the decrease in vacancy that is also at a recent record low.

vacant space and quoted rental rate Q2 industrial

Our Summary/Analysis:

Central PA is considered one of the premier “Big Box” industrial and multi-tenant logistics markets because of the area’s affordable cost of living, raw land and non-union labor. Additionally, the governmental approvals required for warehousing and distribution are comparatively easy and straightforward compared to other states or regions

As far as location, it is a central hub where products can be easily distributed throughout the northeast United States (via I-81, I-83, and I-78) and has seen significant capital invested for expansion of its intermodal system. Central PA also offers easy access to Port of Baltimore, MD and Port of Elizabeth, NJ and is within a one-day drive to 40% of the nation’s population

Now having gained an understanding of just why Central PA makes such an attractive spot for industrial businesses, we can connect the dots as to what the market growth and demand we experienced in the second quarter means for our overall economic health.

Most importantly, this data means that businesses are continuing to move into the area, particularly “Big Box” businesses that rely heavily on distribution. With over 4 million square-feet currently under construction and the highest rental rate in six years, this trend has lasting power. These growing businesses will likely fuel the local area with jobs, spending and an increase in transportation along our highways. Overall, we should feel excited and hopeful about these market trends. Any cons to industrial growth will most certainly be outweighed by the pros!

How will the growth of the local industrial real estate market impact you or your business? Share your personal insights – or ask a question by commenting below!

[Online Resources] Real Estate, 2015, absorption, advice, analysis, camp hill, central pa, costar, cumberland, data, dauphin, demand, economic growth, economic health, Economy, expert, facts, harrisburg, industrial, lancaster, local market, market, mechanicsburg, Mike Kushner, Omni Realty, pennsylvania, prediction future, q2, rental rate, report, second quarter, space, statistics, summary, trends, vacany, warehouse, york

Harrisburg’s Retail Real Estate Hits Record Low Net Absorption in Q1

Posted on June 2, 2015 by mike.kushner in Blog, Commercial Real Estate, Local Market, Trends No Comments

The Central Pennsylvania retail real estate submarket closed First Quarter 2015 with some good news and some bad news. On a positive note, the quoted rental rate is the highest it has been in nearly four years. However, this data is quickly overshadowed by the submarket’s negative net absorption which plummeted 316,783 square feet in a single quarter. Most concerning is how Harrisburg Area East has appeared to bear the brunt of this drop.

So what has gone on in the local retail real estate market this past quarter? And what could be the cause of this major shift in net absorption? Let’s first take a look at what the numbers are saying and then apply them to what this means for the health of the market.

Top Under Construction Properties:

The Central Pennsylvania submarket has two retail properties that are under construction that are among the Top 15 for First Quarter 2015. Coming in at number six, Messina Highlands has an RBA of 30,000 square-feet and is 45% preleased. This property is expected to be delivered in Second Quarter 2015.  Number 15 on the list is a property located at 108 Pauline Drive in York, Pennsylvania. This is expected to deliver an RBA of 7,200 square-feet in Fourth Quarter 2015 and is not preleased.

Select Top Retail Leases:

Out of the Select Top Retail Leases that were signed in First Quarter 2015, there were two Central Pennsylvania properties that made it to the top 10. Coming in at number three, the 46,158 square-foot Toy “R” Us, located in Harrisburg Area West was leased by an unlisted tenant. At number seven, a 14,976 square-foot property located at 611 N. 12th Street in Harrisburg Area East was leased by Save-A-Lot.

Vacancy and Availability:

First Quarter 2015 closed with 4,799,169 square-feet of vacant space. The vacancy % jumped from 5.7% last quarter to 6.0% this quarter. It appears the dip we saw in this number throughout Second, Third and Fourth Quarter 2014 is returning to its higher average in the 6’s, but not nearly as high as it was two years ago at this time. No new buildings were delivered in this quarter, so the total RBA stays put at 60,315,522 square-feet.

Del, Abs and Vac Q1 205 Retail

Absorption and Demand:

The net absorption was the biggest shift we saw in First Quarter 2015. Last quarter ended with a positive 62,480 square-feet, but this number since dropped to negative 254,303 square-feet. This is by far the lowest number we have seen in the Central Pennsylvania retail market in nearly four years. The closest comparison was back in Second Quarter 2012 with a negative net absorption of 49,528 square-feet – but still far off from where we are now.

Looking specifically at Harrisburg Area East, this submarket experienced a negative net absorption of 237,665 square-feet. In comparison to the rest of the submarket, Harrisburg Area West maintained a positive net absorption of 45,041 square-feet as well as York County with 48,431. The rest of the Central Pennsylvania submarket closed the Quarter with a negative net absorption, but not nearly as low as Harrisburg Area East. Adams County ended with negative 3,672 square-feet; Lancaster County ended with negative 98,938 square feet; and Perry County ended with negative 7,500 square-feet.

Rental Rates:

The quoted rental rate for First Quarter 2015 is $11.51. This is a mere penny increase from the previous quarter, which is just enough to bring it to the highest rate we have seen in Central Pennsylvania’s retail real estate market in nearly four years.

Vac space and quoted rental rates Q1 205 Retail

Our Summary/Analysis:

In some markets, retailers that are back in expansion mode are bumping up against a big obstacle – a lack of inventory when it comes to good real estate locations. The limited supply of new retail construction has been a huge help to improving absorption and vacancies. However, the Harrisburg East Submarket which is part of the Central Pennsylvania Submarket Cluster (including Adams, Cumberland, Dauphin, Lancaster, Perry and York counties) struggled in Q1 2015.  The major contributors were the closing of a Sears store in the Lebanon Plaza Mall and the Kmart at 2090 Lincoln Highway in Lancaster.

Sears Holdings Corporation, the company that runs Sears and Kmart, has a problem. They have a lot of real estate and not enough sales to keep all that real estate busy. As a result, they are forced to close stores that underperform or as their leases expire. In buildings they own or hold long-term leases, they often opt to rent out space to other businesses to try and minimize expenses as much as possible.

Harrisburg East experienced an unfortunate setback in Q1, but as a whole, the Central Pennsylvania submarket’s economic health looks hopeful for the remaining quarters. It’s important that we continue to watch other Sears Holdings Corporation’s real estate locations as well as any other big businesses that are struggling and closing retail locations as a result.

What other trends in the retail real estate market have you seen take place in First Quarter 2015? Share your insights by commenting below!

[Online Resources] Real Estate, 2015, absorption, adams county, availabilty, camp hill, central pennsylvania, Commercial Real Estate, Construction, demand, east, Economy, first quarter, forecast, harrisburg, health, lancaster, leases, lebanon, mechanicsburg, Mike Kushner, news, Omni Realty, pa, q1, report, retail, trends, vacany, west, york

Subscribe To Our Blog

  • This field is for validation purposes and should be left unchanged.

Mike J Kushner, CCIM

  • Contact me for a FREE Lease Review!
  • This field is for validation purposes and should be left unchanged.

Categories

  • About Us
  • Blog
  • CCIM
  • Commercial Real Estate
  • Community
  • Construction
  • CPBJ Articles
  • CREDC Articles
  • Feature
  • Featured Opportunities
  • Guest Blogger
  • Healthcare
  • In the News
  • Industrial
  • Local Market
  • Office Leasing
  • Retail
  • Success Stories
  • Tenant Representative/Buyer Agent
  • Trends

(c) 2019 OMNI REALTY GROUP- Website Design by The John Webster Company